Cara Uji Asumsi Klasik: Normalitas, Multikolinearitas dan Heteroskedastisitas Menggunakan SPSS
Summary
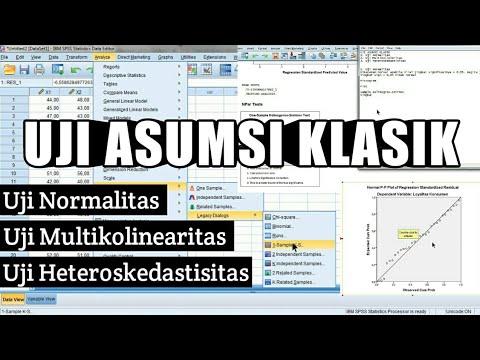
TLDRIn this tutorial, Muhammad Naim guides viewers through performing classical assumption tests in SPSS, focusing on normality, multicollinearity, and heteroskedasticity. He demonstrates how to prepare data from questionnaires, input it into SPSS, and execute the tests with clear explanations. Using histograms, Q-Q plots, and the Kolmogorov-Smirnov test, he shows how to assess normality. Multicollinearity is evaluated with tolerance and VIF values, while heteroskedasticity is checked using scatter plots of residuals. The video provides practical, step-by-step instructions, helping learners ensure their regression models meet key statistical assumptions for accurate and reliable analysis.
Takeaways
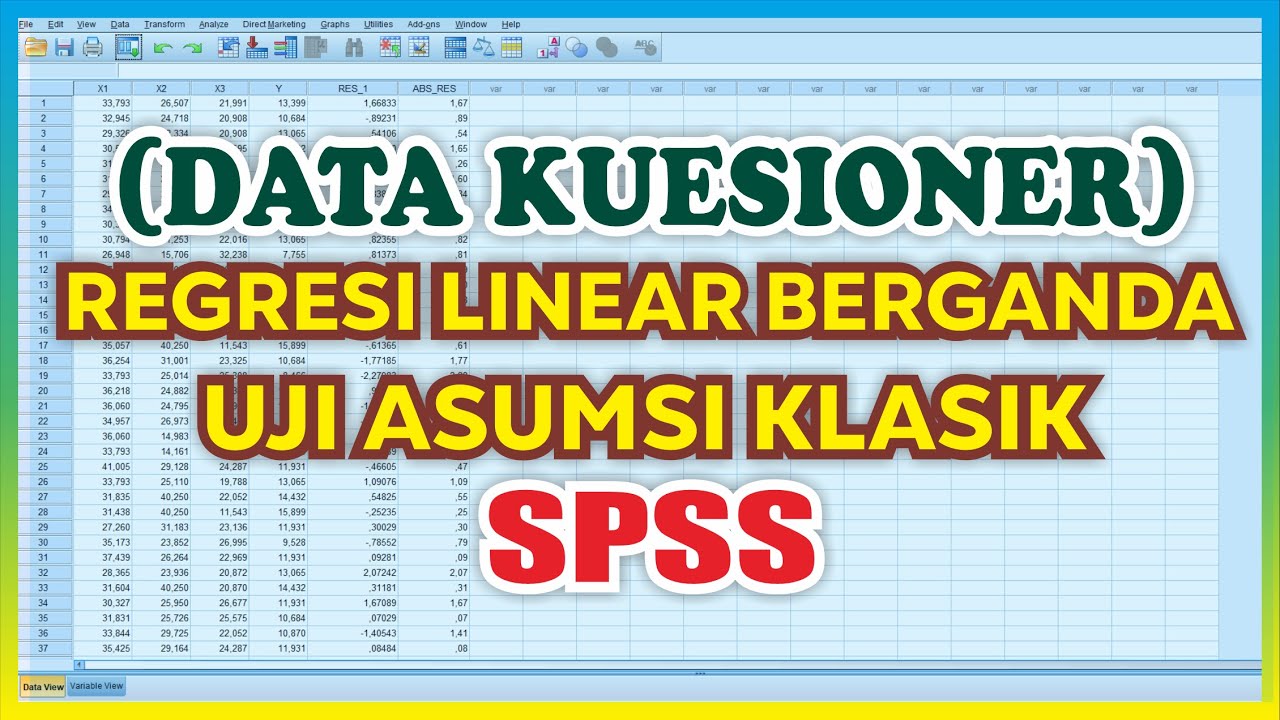
- 😀 The tutorial explains how to perform classical assumption tests in SPSS using questionnaire data.
- 😀 Three main tests are covered: normality, multicollinearity, and heteroskedasticity.
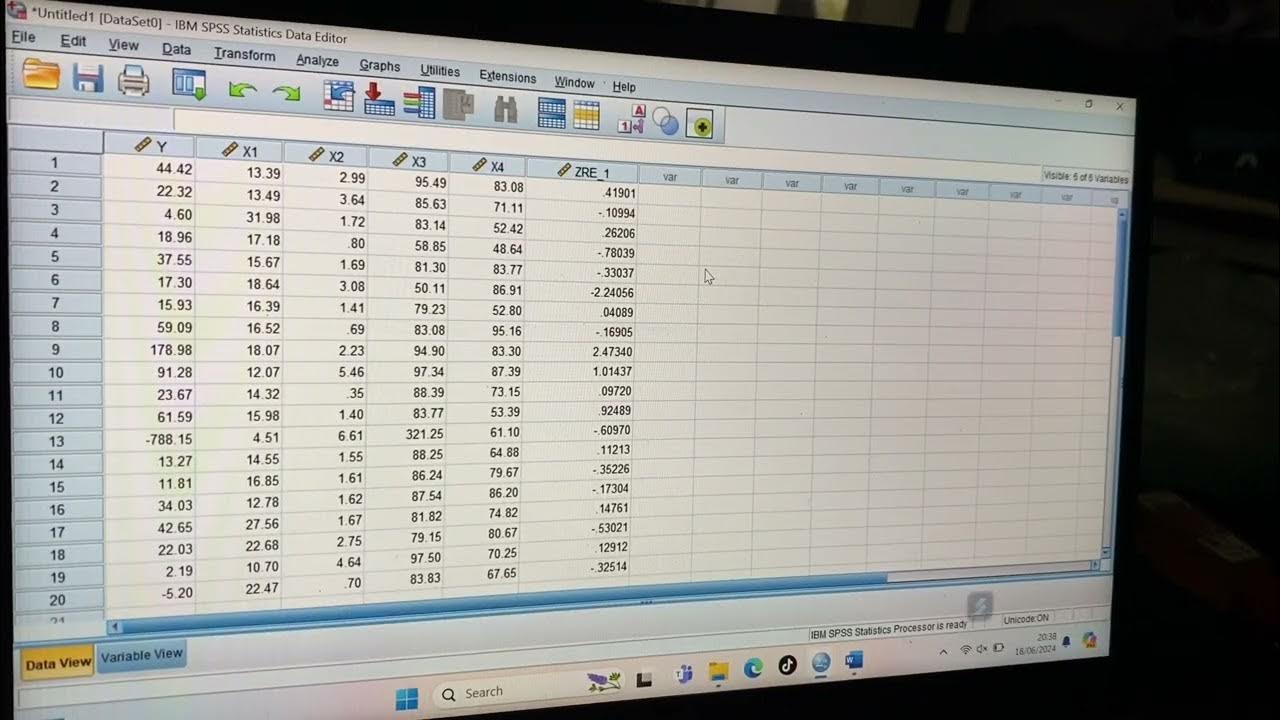
- 😀 Users must first prepare and input their dataset correctly into SPSS before running analyses.
- 😀 Normality testing ensures that residuals are distributed normally, which is essential for a good regression model.
- 😀 A histogram with a bell-shaped curve indicates that the data is normally distributed.
- 😀 In a P-P Plot, data points following the diagonal line suggest normal distribution.
- 😀 The Kolmogorov-Smirnov test determines normality using significance values (Sig. > 0.05 means normal).
- 😀 Multicollinearity testing checks whether independent variables are highly correlated with each other.
- 😀 Tolerance values greater than 0.10 and VIF values less than 10 indicate no multicollinearity.
- 😀 Heteroskedasticity testing examines whether residual variance is consistent across observations.
- 😀 A scatterplot with randomly spread points above and below zero indicates no heteroskedasticity.
- 😀 If all three assumptions are satisfied, the regression model is considered valid and reliable for analysis.
Q & A
What is the main topic of the video by Muhammad Naim?
-The main topic is performing classical assumption tests in regression analysis using SPSS, focusing on normality, multicollinearity, and heteroskedasticity.
How many variables were used in the SPSS example provided in the video?
-Three variables were used: two independent variables (X1 and X2) and one dependent variable (Y).
What is the purpose of the normality test in regression analysis?
-The normality test determines whether the residuals (errors) in the regression model are normally distributed, which is a key assumption for valid statistical inference.
Which three methods were used in the video to test for normality?
-The three methods are: histogram analysis, Normal Q-Q plot, and the Kolmogorov-Smirnov test.
What indicates that the data are normally distributed in the histogram and Q-Q plot?
-In the histogram, a bell-shaped curve indicates normal distribution. In the Q-Q plot, if the data points follow the diagonal line, it indicates normal distribution.
How can one determine normality using the Kolmogorov-Smirnov test in SPSS?
-If the significance value is greater than 0.05, the data are considered normally distributed. In the example, the significance value was 0.099, confirming normality.
What is the purpose of the multicollinearity test in regression?
-The multicollinearity test checks whether there is a high correlation between independent variables, which can distort regression results.
What are the criteria for determining the absence of multicollinearity?
-Two criteria: tolerance should be greater than 0.10, and the Variance Inflation Factor (VIF) should be less than 10.
What were the results of the multicollinearity test in the video example?
-Both X1 and X2 had tolerances of 0.958 and VIFs of 1.044, indicating that multicollinearity was not present.
What is the purpose of the heteroskedasticity test?
-The heteroskedasticity test checks whether the variance of residuals is constant across all levels of the independent variables. Unequal variance indicates heteroskedasticity.
How can one visually assess heteroskedasticity in SPSS?
-By plotting a scatter plot of residuals versus predicted values. A random, evenly spread pattern around zero indicates no heteroskedasticity.
What was the conclusion regarding heteroskedasticity in the video?
-The scatter plot showed residuals evenly spread above and below zero, indicating that heteroskedasticity was not present in the data.
Why is it important to test these classical assumptions before regression analysis?
-Testing these assumptions ensures that the regression results are valid, reliable, and that statistical inferences, such as hypothesis tests, are accurate.
Outlines

Esta sección está disponible solo para usuarios con suscripción. Por favor, mejora tu plan para acceder a esta parte.
Mejorar ahoraMindmap

Esta sección está disponible solo para usuarios con suscripción. Por favor, mejora tu plan para acceder a esta parte.
Mejorar ahoraKeywords

Esta sección está disponible solo para usuarios con suscripción. Por favor, mejora tu plan para acceder a esta parte.
Mejorar ahoraHighlights

Esta sección está disponible solo para usuarios con suscripción. Por favor, mejora tu plan para acceder a esta parte.
Mejorar ahoraTranscripts

Esta sección está disponible solo para usuarios con suscripción. Por favor, mejora tu plan para acceder a esta parte.
Mejorar ahoraVer Más Videos Relacionados
Tutorial SPSS Uji Asumsi Klasik : Uji Normalitas, Uji Multikolinearitas dan Uji Heteroskedastisitas
Uji Asumsi Klasik SPSS Data Kuesioner beserta Analisis Regresi Linear Berganda
Tutorial Menggunakan Spss untuk data Panel

Tutorial Uji Asumsi Klasik dengan SPSS serta Interpretasi Output
TUTORIAL UJI ASUMSI KLASIK VARIABEL MODERASI DENGAN SPSS -TERBARU ❗❗❗
Tutorial Uji Asumsi Klasik (Prasyarat) Beserta Uji Regresi Berganda Dengan SPSS
5.0 / 5 (0 votes)
