Comparing Linear, Exponential, and Quadratic Functions
Summary
TLDRThis video covers the comparison of linear, exponential, and quadratic functions. It starts by explaining the formulas for each type of function, including the components of the linear equation (y = mx + b), the exponential equation (y = AB^x), and the quadratic equation (y = ax^2 + bx + c). The video highlights the distinct characteristics of each type, such as the shape of their graphs and how to identify them from tables and points. The tutorial also discusses the importance of second differences in recognizing quadratic functions, providing practice examples to reinforce learning.
Takeaways
- 😀 The unit covers the comparison of linear, exponential, and quadratic functions, building on prior knowledge from previous units.
- 😀 A linear function has the formula y = mx + b, where m is the slope and b is the y-intercept, and its graph is a straight line.
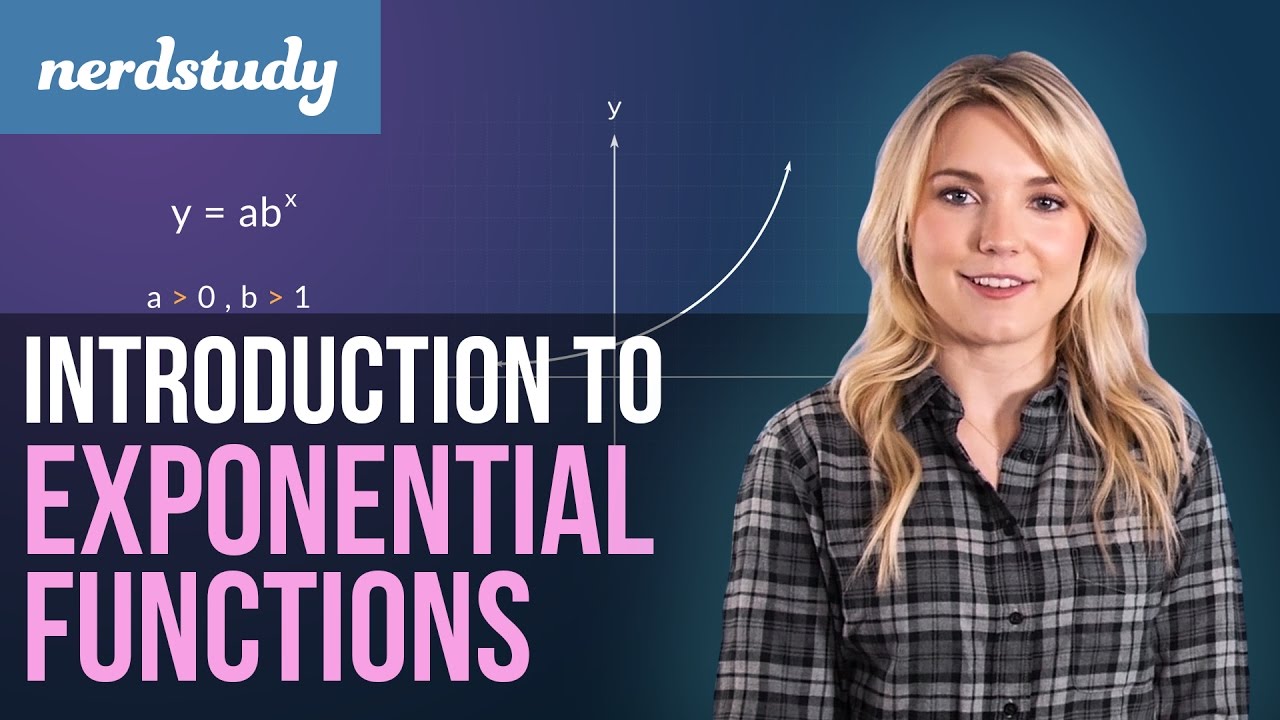
- 😀 An exponential function is represented by y = AB^x, where A is the y-intercept (starting value) and B is the growth rate, with the graph being a curve.
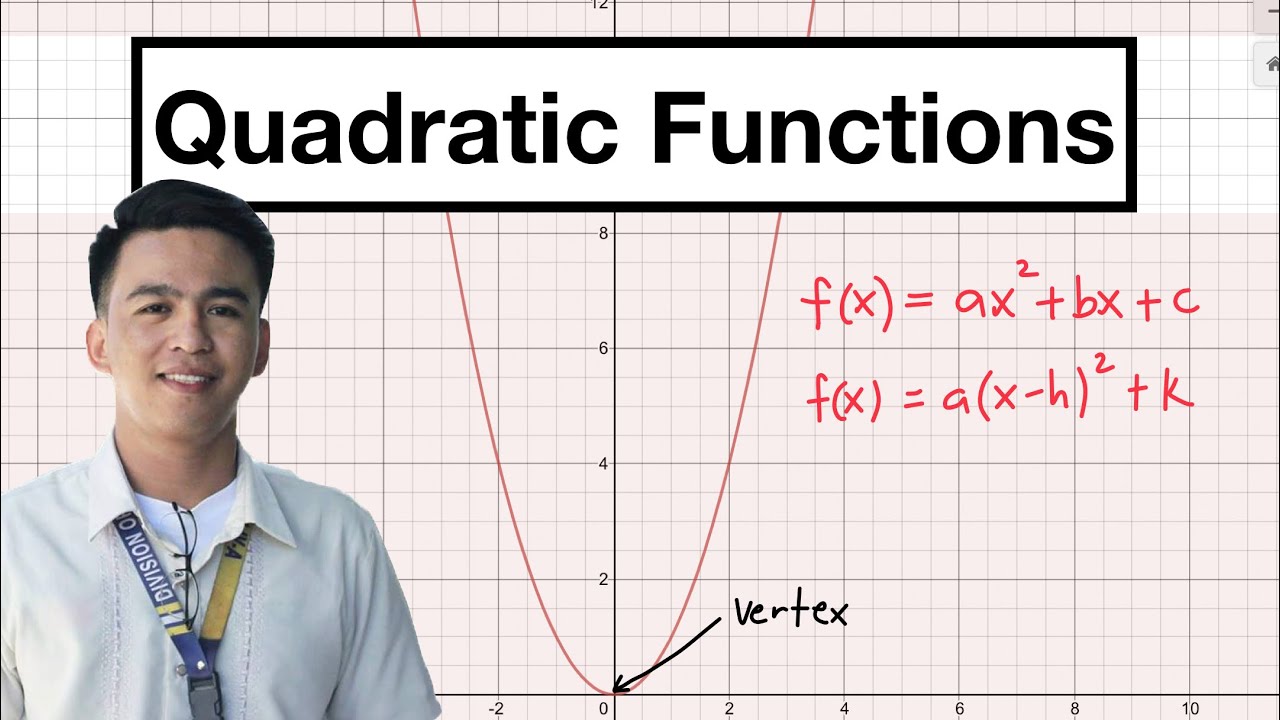
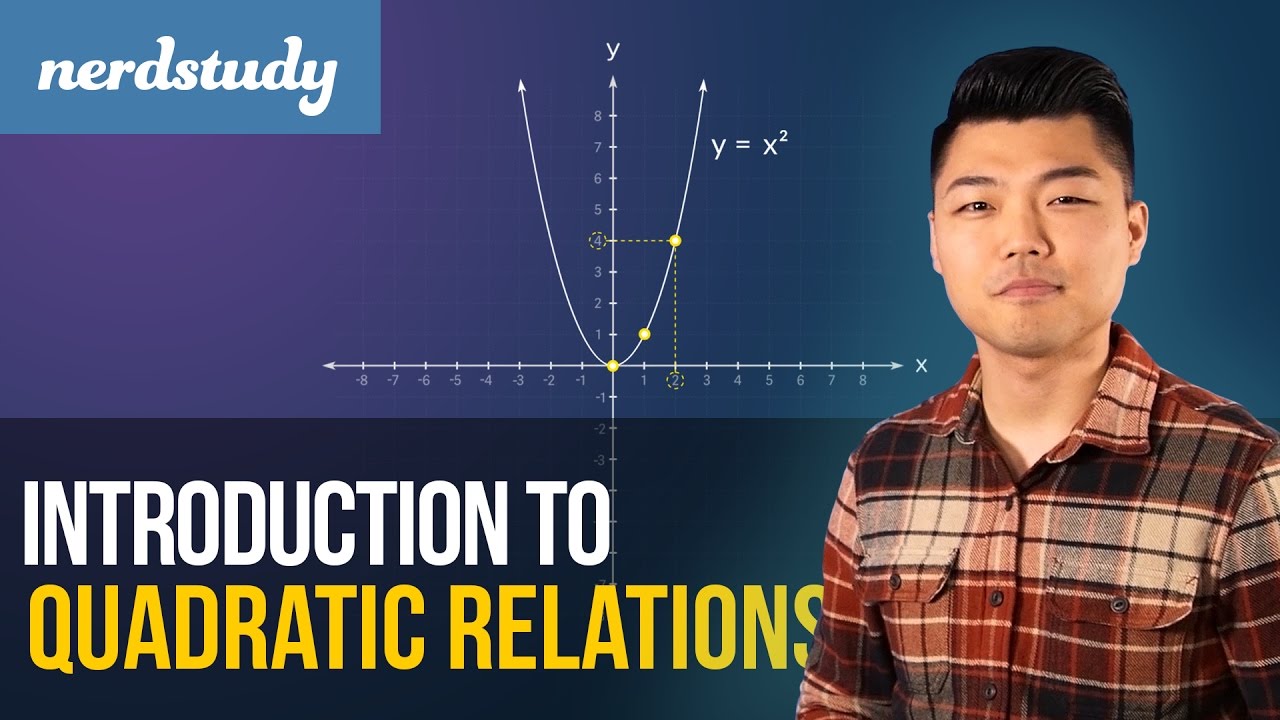
- 😀 A quadratic function is written in standard form as y = ax^2 + bx + c, with a parabolic graph. The vertex form of a quadratic is y = a(x-h)^2 + k.
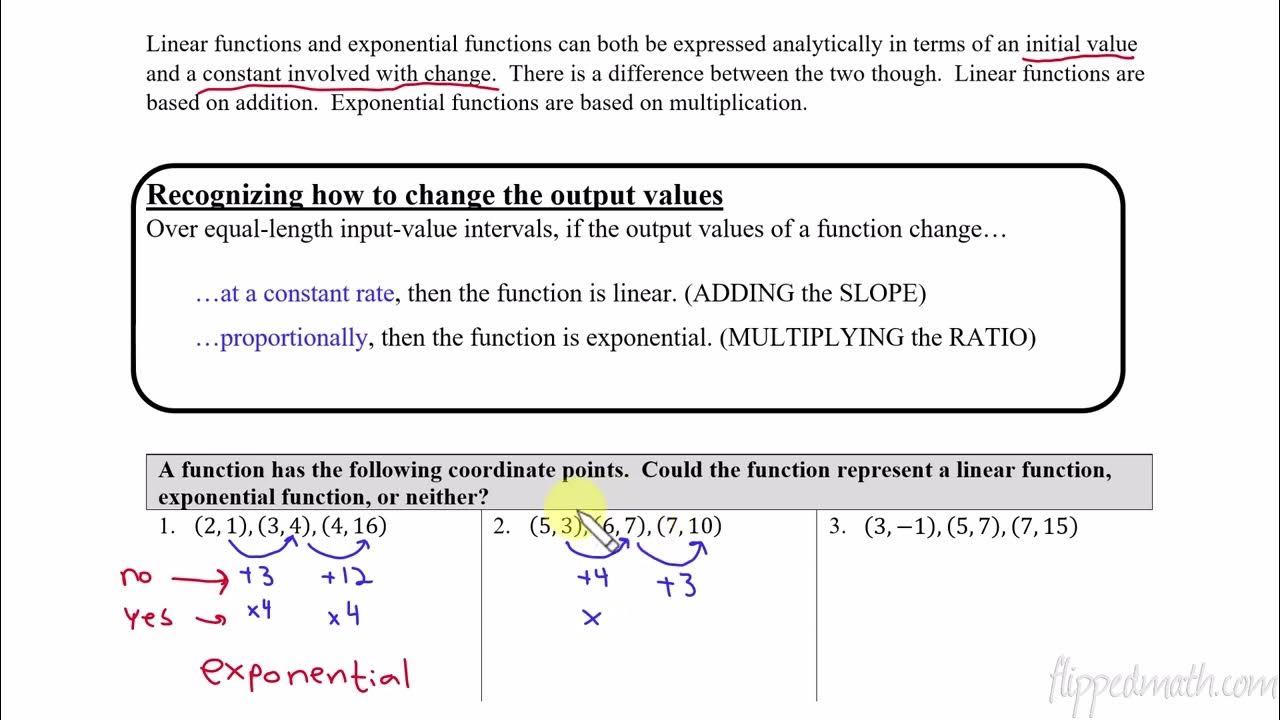
- 😀 Linear functions are identified by a constant difference in the y-values for equal increments in x-values (common difference).
- 😀 Exponential functions are identified by a constant ratio of change between consecutive y-values (common ratio).
- 😀 Quadratic functions can be recognized by constant second differences in the table of values, where the first differences change by the same amount.
- 😀 The key visual difference between these functions is that linear functions create a straight line, exponential functions create a curve, and quadratic functions form a parabola.
- 😀 In practice, linear functions have equal spacing in both x and y, while exponential functions grow or decay by a constant factor.
- 😀 To identify a quadratic function from a table, check if the first differences change at a constant rate. If they do, the function is quadratic.
- 😀 The script highlights practice problems from lesson 8.5, which include exercises for further understanding and distinguishing between these types of functions.
Q & A
What are the three types of functions discussed in the video?
-The three types of functions discussed are linear, exponential, and quadratic functions.
What is the general formula for a linear function?
-The general formula for a linear function is y = mx + b, where m is the slope and b is the y-intercept.
In an exponential function, what do the variables A and B represent?
-In an exponential function, A represents the y-intercept or starting value, while B represents the rate of change or the growth factor.
What is the standard form of a quadratic function?
-The standard form of a quadratic function is y = ax^2 + bx + c.
What is the difference between the vertex form and the standard form of a quadratic function?
-The vertex form of a quadratic function is y = a(x - h)^2 + k, where (h, k) is the vertex, whereas the standard form is y = ax^2 + bx + c, which does not directly show the vertex.
How can you tell if a set of points represents a linear, exponential, or quadratic function?
-You can tell by analyzing the shape of the graph or the differences in the table of values. Linear functions form a straight line, exponential functions form a curve, and quadratic functions form a parabola.
What is a key feature of quadratic functions when analyzing a table of values?
-A key feature of quadratic functions is that the second differences between the Y-values are constant.
What does the constant difference in a table of values indicate about a function?
-A constant first difference indicates that the function is linear, while a constant second difference indicates that the function is quadratic.
What is the primary method used to identify an exponential function from a table of values?
-To identify an exponential function, check for a constant ratio between consecutive Y-values, as exponential functions multiply by a constant factor.
How would you classify a table where the X-values increase by a constant amount and the Y-values change by increasing differences like +1, +3, +5, +7?
-This table represents a quadratic function, as the second differences between the Y-values are constant.
Outlines

Esta sección está disponible solo para usuarios con suscripción. Por favor, mejora tu plan para acceder a esta parte.
Mejorar ahoraMindmap

Esta sección está disponible solo para usuarios con suscripción. Por favor, mejora tu plan para acceder a esta parte.
Mejorar ahoraKeywords

Esta sección está disponible solo para usuarios con suscripción. Por favor, mejora tu plan para acceder a esta parte.
Mejorar ahoraHighlights

Esta sección está disponible solo para usuarios con suscripción. Por favor, mejora tu plan para acceder a esta parte.
Mejorar ahoraTranscripts

Esta sección está disponible solo para usuarios con suscripción. Por favor, mejora tu plan para acceder a esta parte.
Mejorar ahoraVer Más Videos Relacionados
Introduction to Exponential Functions - Nerdstudy

Comparing Linear, Exponential, and Quadratic Functions
Introduction to Quadratic Function | Examples of Quadratic Function
AP Precalculus – 2.2 Change in Linear and Exponential Functions

O QUE ESTUDAR PARA O ENEM 2025? (TODAS AS MATÉRIAS) | Proenem
Intro to Quadratic Functions (Relations) - Nerdstudy
5.0 / 5 (0 votes)
