Boxplot Satu Materi Part 2
Summary
TLDRThis tutorial guides viewers through the process of applying TPCK (Technological Pedagogical Content Knowledge) in Excel to perform descriptive statistical analysis. It begins by showing how to enable the Analysis ToolPak add-in, followed by steps for selecting and configuring data to generate meaningful statistical outputs. The tutorial emphasizes correct data selection and output range management, ensuring users understand how to use Excel's analysis tools effectively. This easy-to-follow guide offers a practical approach to applying statistical methods in Excel, helping viewers enhance their skills in data analysis.
Takeaways
- 😀 Start by navigating to the 'File' menu in Excel.
- 😀 Click on 'Options' at the bottom of the File menu to access additional settings.
- 😀 Select 'Add-Ins' and choose the 'Analysis Toolpak' add-in option.
- 😀 After selecting 'Analysis Toolpak', click 'Go' and make sure to enable the 'Analysis Toolpak' add-in.
- 😀 Once enabled, go to the 'Data' menu and select 'Data Analysis' on the right side of the screen.
- 😀 From the 'Data Analysis' options, choose 'Descriptive Statistics'.
- 😀 After selecting 'Descriptive Statistics', click 'OK' to proceed with the analysis.
- 😀 Make sure to check both 'Output Range' and 'Summary Statistics' for proper output.
- 😀 Use the 'Arrow' button to select a range for displaying the output, ensuring the area is empty to avoid overwriting any data.
- 😀 Copy the data (numbers only, no text) to the specified output range and ensure the input columns are selected correctly.
- 😀 Once all options are set, click 'OK' and wait for the output to appear, completing the descriptive statistics analysis.
Q & A
What is the first step to apply TPCK in Google Meet as described in the script?
-The first step is to go to the 'File' menu, then click on 'Options' at the bottom of the menu. After that, you should select 'Add-in'.
What should you do after clicking on 'Add-in' in the options menu?
-Once you click 'Add-in', a window will appear where you need to select 'Manage' or 'Excel Add-ins'. After selecting this, click 'Go'.
What are the options available in the add-in window and which one should be selected?
-The available options are 'Analysis Toolpak FBA', 'Analysis Toolpak', 'Eurocurrency Tool', and 'Pemeca Add-in'. You should select 'Analysis Toolpak' and not the one with 'FBA'.
What should you do once the 'Analysis Toolpak' is selected?
-After selecting 'Analysis Toolpak', click 'OK'. This completes the first step of the process.
Which menu should you go to after completing the first step?
-After completing the first step, you need to go to the 'Data' menu.
What should you click on in the 'Data' menu?
-In the 'Data' menu, click on 'Data Analysis' in the top-right corner.
Which analysis option should be chosen from the 'Data Analysis' menu?
-From the 'Data Analysis' menu, you should select 'Descriptive Statistics', which is the 6th option from the top.
What are the two settings you need to select under 'Descriptive Statistics'?
-Under 'Descriptive Statistics', you need to select 'Output Range' and 'Summary Statistics'.
What should you do before clicking the 'OK' button in the 'Descriptive Statistics' settings?
-Before clicking 'OK', ensure that you have selected the correct columns for the data and that you have copied only the numbers, not the text.
What happens after you click 'OK' in the 'Descriptive Statistics' window?
-After clicking 'OK', the output of the analysis will appear in the specified output range, showing the results of the statistical analysis.
Outlines

Esta sección está disponible solo para usuarios con suscripción. Por favor, mejora tu plan para acceder a esta parte.
Mejorar ahoraMindmap

Esta sección está disponible solo para usuarios con suscripción. Por favor, mejora tu plan para acceder a esta parte.
Mejorar ahoraKeywords

Esta sección está disponible solo para usuarios con suscripción. Por favor, mejora tu plan para acceder a esta parte.
Mejorar ahoraHighlights

Esta sección está disponible solo para usuarios con suscripción. Por favor, mejora tu plan para acceder a esta parte.
Mejorar ahoraTranscripts

Esta sección está disponible solo para usuarios con suscripción. Por favor, mejora tu plan para acceder a esta parte.
Mejorar ahoraVer Más Videos Relacionados
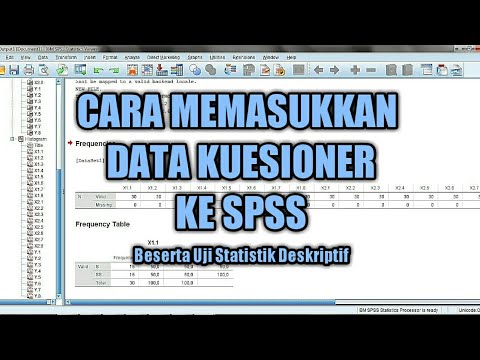
CARA MEMASUKKAN DATA KUESIONER KE SPSS - Beserta Uji Statistik Deskriptif
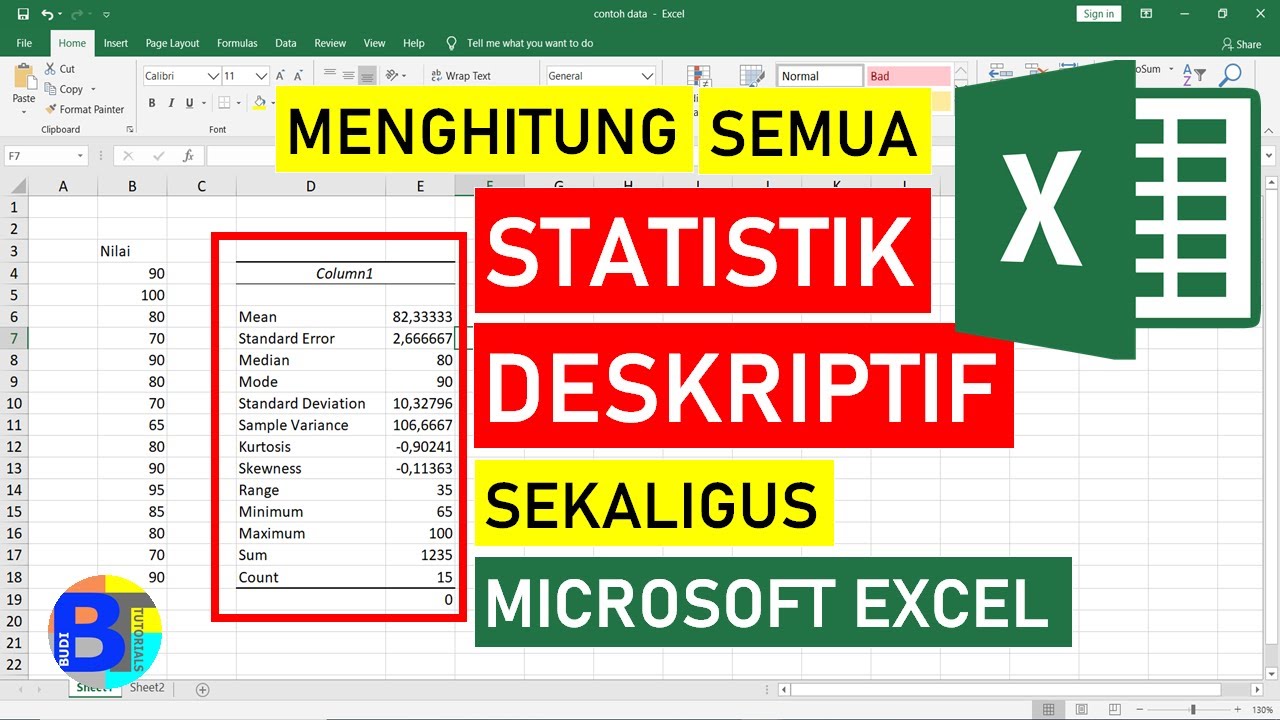
Cara Menghitung Statistik Deskriptif dengan Excel || Statistik Excel
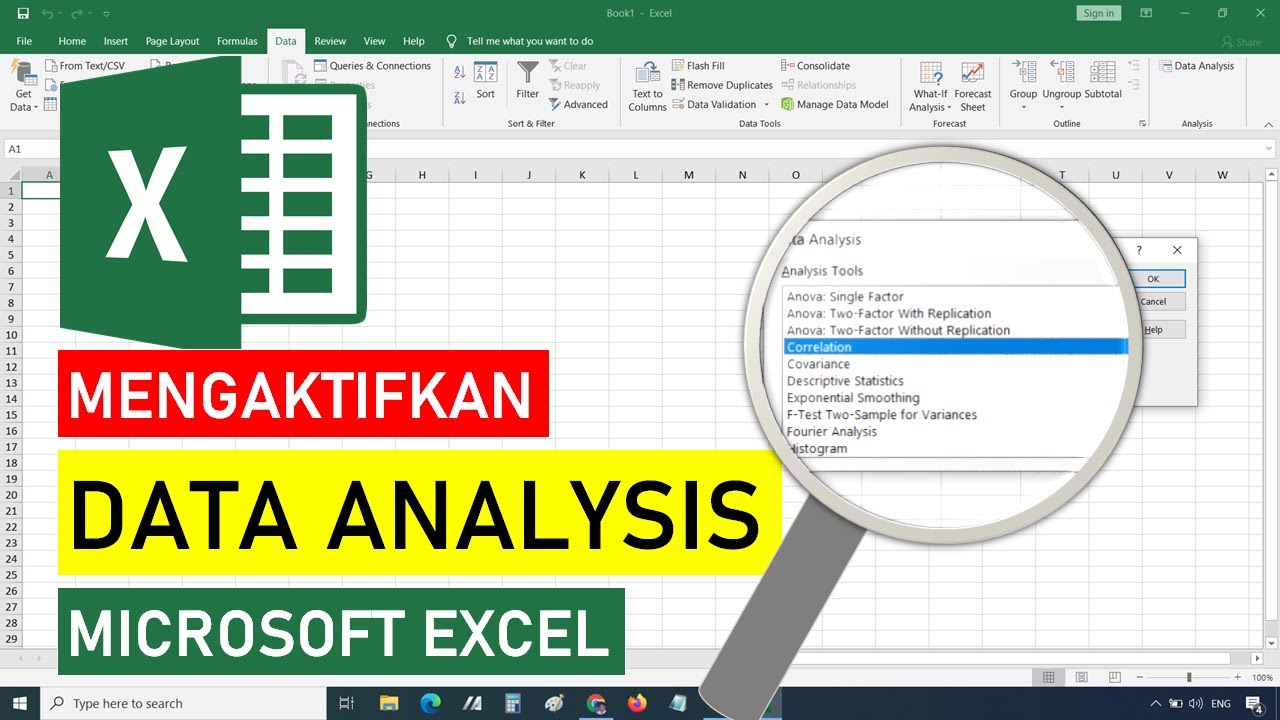
Cara Mengaktifkan Data Analysis di Excel || STATISTIK EXCEL

Komparasi Kategorik Part 2

CARA ANALISA DESKRIPTIF TINGKAT CAPAIAN RESPONDEN,TCR,TOTAL SKOR,RATA RATA,MEAN,KATEGORI,EXCEL SPSS

How to analyze data using Epi Info For PC. Easy Peasy Tutorial for Beginners
5.0 / 5 (0 votes)
