Program Linear: 1.Menentukan grafik pertidaksamaan linear satu variabel
Summary
TLDRThis video provides an in-depth explanation of linear programming, focusing on solving linear inequalities using graphical methods. The lecturer demonstrates how to graph solutions to inequalities, emphasizing the use of solid and dashed lines depending on whether the inequality includes equality. Several examples are given, where the feasible solution regions are identified by shading on a Cartesian plane. The tutorial aims to help students visualize and understand the concept of linear programming and its application in optimizing objective functions, especially in industrial settings.
Takeaways
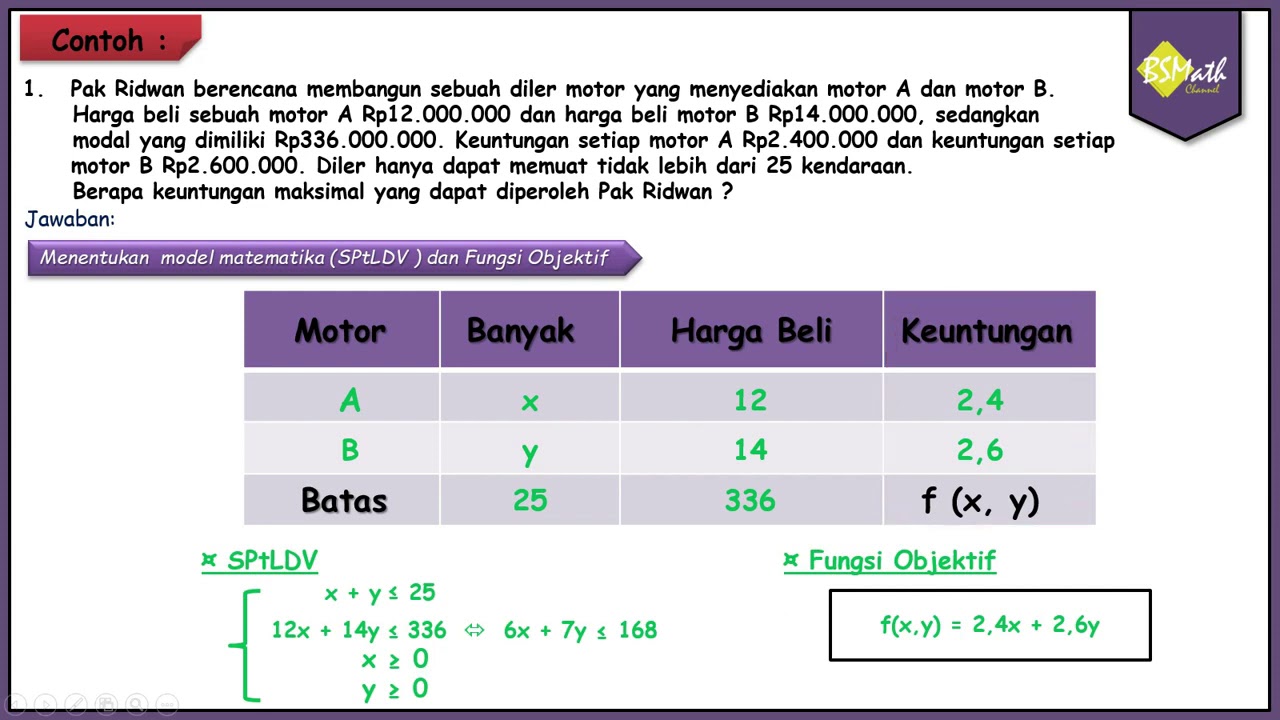
- 😀 The script discusses the concept of linear programming, which is an extension of linear inequalities and focuses on finding optimal solutions for industrial problems using mathematical models.
- 😀 The lecture highlights that linear programming is used to solve optimization problems, determining the maximum or minimum value of an objective function.
- 😀 The first example in the script demonstrates how to graph a solution set for a linear inequality, such as x ≤ -4, using a Cartesian plane.
- 😀 The difference between solid and dashed lines in graphs is explained: a solid line indicates inclusion of the boundary point, while a dashed line indicates exclusion.
- 😀 The script covers how to shade regions on a graph to represent the solution set of inequalities, such as shading to the left for x < 4 and to the right for x > 3.
- 😀 For inequalities like x ≤ 4 or y ≤ 1, the graphing method helps visualize the solution set by marking points and drawing lines that divide the plane.
- 😀 In solving linear inequalities, understanding the significance of whether the boundary line is included (solid line) or excluded (dashed line) is crucial.
- 😀 The script stresses the importance of correctly interpreting the signs in inequalities (greater than, less than, or equal to) when graphing the solution region.
- 😀 A key point in the script is demonstrating how to graph complex inequalities with multiple variables and boundary points using the Cartesian plane.
- 😀 The lecture concludes by encouraging students to practice by repeating the steps in the video, ensuring understanding of graphing linear inequalities and solution regions.
Q & A
What is linear programming and how is it applied?
-Linear programming is a method used to solve problems that are formulated as a system of linear inequalities. It helps in finding optimal solutions (either maximum or minimum) for an objective function by analyzing the feasible region, which is defined by these inequalities.
How is the graphical method used in linear programming?
-The graphical method involves plotting the linear inequalities on a Cartesian plane, drawing the corresponding lines, and shading the solution region. The region where all inequalities overlap represents the feasible solutions.
What is the difference between a solid and a dashed line in graphing inequalities?
-A solid line is used when the inequality includes 'equal to' (e.g., x ≤ 4), indicating that points on the line are included in the solution set. A dashed line is used when there is no 'equal to' (e.g., x > 3), meaning the points on the line are not part of the solution set.
How do you graph the inequality 'x ≤ 4'?
-To graph x ≤ 4, draw a solid vertical line at x = 4, and shade the region to the left of the line to indicate all values of x that are less than or equal to 4.
What happens when you graph the inequality 'x > 3'?
-For x > 3, draw a dashed vertical line at x = 3 and shade the region to the right of the line to represent values of x that are greater than 3. The dashed line indicates that x = 3 is not part of the solution.
How would you graph 'y ≤ 1' on the Cartesian plane?
-To graph y ≤ 1, draw a solid horizontal line at y = 1, and shade the region below the line to indicate all values of y that are less than or equal to 1.
What is the significance of shading the region when solving inequalities?
-Shading the region helps visualize the solution set for the inequality. The shaded area represents the values that satisfy the inequality, and where multiple shaded regions overlap, we find the feasible solution.
What does it mean when a solution region is unbounded?
-An unbounded solution region means that the feasible region extends infinitely in a particular direction. For example, when the inequality has 'greater than' or 'less than' (without 'equal to'), the region will continue indefinitely in that direction.
How does the inclusion of 'equal to' affect the graph of an inequality?
-The inclusion of 'equal to' means that the boundary line is part of the solution set. This is represented by a solid line in the graph. Without 'equal to', the boundary line is excluded, and the line is dashed.
How do you graph inequalities involving intervals, such as '2 < x < 5'?
-For inequalities like '2 < x < 5', you draw dashed lines at x = 2 and x = 5 to indicate the boundaries. The solution region is the area between these lines, not including the lines themselves, since the inequality does not include 'equal to'.
Outlines

Esta sección está disponible solo para usuarios con suscripción. Por favor, mejora tu plan para acceder a esta parte.
Mejorar ahoraMindmap

Esta sección está disponible solo para usuarios con suscripción. Por favor, mejora tu plan para acceder a esta parte.
Mejorar ahoraKeywords

Esta sección está disponible solo para usuarios con suscripción. Por favor, mejora tu plan para acceder a esta parte.
Mejorar ahoraHighlights

Esta sección está disponible solo para usuarios con suscripción. Por favor, mejora tu plan para acceder a esta parte.
Mejorar ahoraTranscripts

Esta sección está disponible solo para usuarios con suscripción. Por favor, mejora tu plan para acceder a esta parte.
Mejorar ahoraVer Más Videos Relacionados
Latihan Soal - Part 2
SPtLDV (Sistem Pertidaksamaan Linear Dua Variabel) Kelas 10 Kurikulum Merdeka
Pembahasan Buku PR Matematika Kelas XB Intan Pariwara|Asesmen 2 Pilihan Ganda No.1-10|Kurmer
Materi:Himpunan Penyelesaian Sistem Pertidaksamaan Linear (Dua) Variabel" (SPTLDV) Kelompok-1

Konsep Pertidaksamaan Nilai Mutlak
Menyelesaikan Permasalahan Program Linear Menentukan Nilai Optimum dengan Metode Uji Titik Pojok
5.0 / 5 (0 votes)
