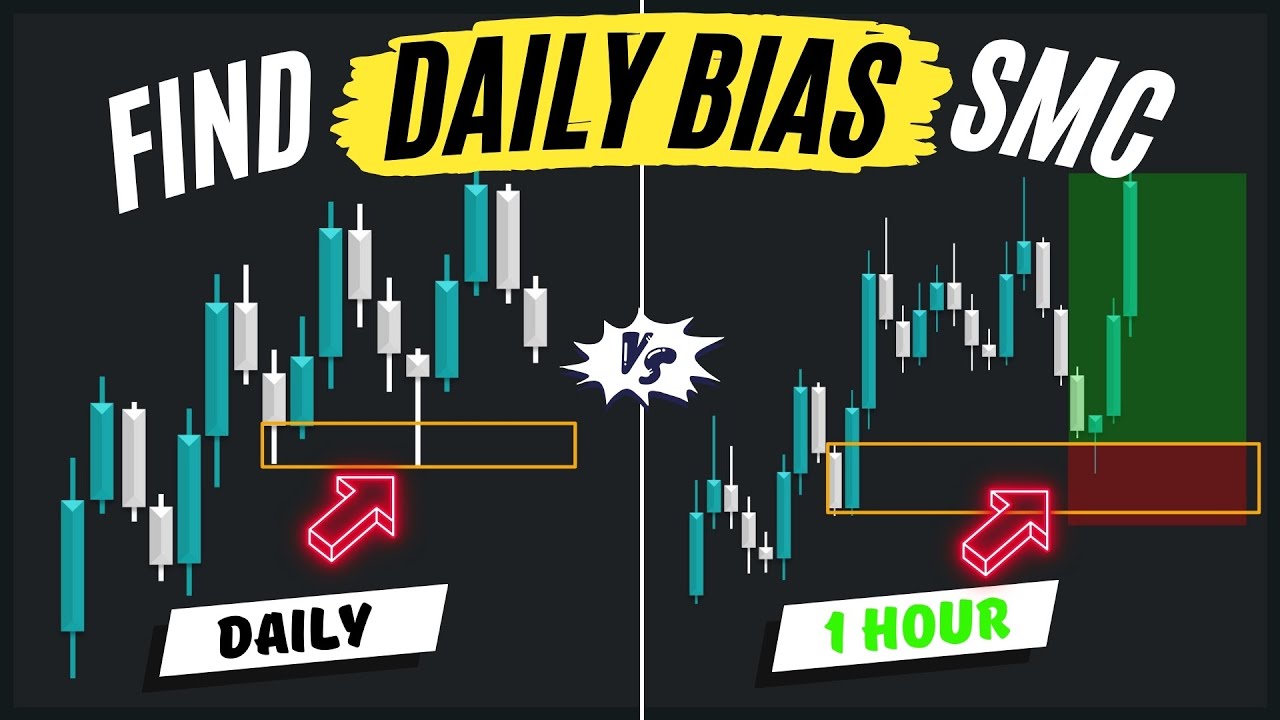
How to Find Liquidity Zones on Gold Chart Easily (XAUUSD analysis)
Summary
TLDRIn this video, the concept of liquidity zones on gold charts is explained, focusing on their importance for traders. The video covers how to identify significant liquidity zones, which represent areas of high market activity. It details the strategy of drawing supply and demand zones, based on historical price levels, to forecast potential price movements. Viewers are taught to look for buying opportunities in demand zones and selling opportunities in supply zones. The video also emphasizes the importance of timeframes and the strength of liquidity zones, while providing actionable insights for effective trading.
Takeaways
- 😀 Liquidity zones are important areas on a price chart where trading activity accumulates, representing supply and demand levels.
- 😀 A supply zone is a liquidity zone above the current price level where excess supply will push the price down.
- 😀 A demand zone is a liquidity zone below the current price level where excess demand will push the price up.
- 😀 Liquidity zones can be identified using various methods like Fibonacci, technical indicators, or order flow, with historical price levels being one of the most effective ways.
- 😀 To draw liquidity zones, identify significant price levels where strong price movements occurred in the past and connect the highest and lowest points of those movements.
- 😀 A significant price level can be marked by a strong bullish or bearish move, indicating its historical relevance.
- 😀 When analyzing liquidity zones, it’s essential to remove unnecessary horizontal levels from the chart for clarity.
- 😀 When the price reaches a liquidity zone, look for confirmation (e.g., bullish imbalance) before executing trades.
- 😀 Higher time frames tend to have stronger, more significant liquidity zones.
- 😀 The strategy for identifying liquidity zones involves both supply and demand zones, with buying opportunities in demand zones and selling opportunities in supply zones.
- 😀 Always monitor for violations of liquidity zones—if a demand zone is violated, it may turn into a supply zone, signaling a bearish continuation, and vice versa for a supply zone.
Q & A
What is a liquidity zone in gold trading?
-A liquidity zone is a price level where there is a concentration of market activity, either buying or selling. These zones are crucial for predicting price movements as they represent areas of significant market interest in the past.
What are supply and demand zones?
-Supply zones are liquidity zones above the current price level where excess selling orders will be absorbed by buyers, acting as resistance. Demand zones are liquidity zones below the current price level where excess buying orders will be absorbed by sellers, acting as support.
Why are liquidity zones important in trading?
-Liquidity zones help traders predict where the price is likely to move next. When there is an imbalance between buying and selling, the price tends to move toward the nearest liquidity zone, providing key insights for profitable trading opportunities.
How can liquidity zones be identified?
-Liquidity zones can be identified using methods like Fibonacci retracements, technical indicators, and order flow analysis. A highly effective method is analyzing historically significant price levels where strong bullish or bearish movements have occurred.
What is the strategy to identify liquidity zones in gold?
-The strategy involves identifying historically significant price levels where strong price movements have originated. These levels can form supply and demand zones, which help traders determine where to focus their trading activity.
How do you draw a supply zone?
-To draw a supply zone, take the highest price level and the lower boundary, typically the highest candle close. This forms the upper boundary of the supply zone, where the price may face resistance.
How do you draw a demand zone?
-To draw a demand zone, identify historically significant price levels showing a strong bullish reaction. Take the lowest price level and the upper boundary, usually the closest candle close, to define the demand zone where prices may find support.
What should you do after identifying liquidity zones?
-After identifying liquidity zones, clean your chart by removing horizontal levels for clarity. Then, look for trading opportunities within these zones: buying from demand zones and selling from supply zones.
How do you confirm trading opportunities in liquidity zones?
-To confirm trading opportunities, look for imbalance signals within the liquidity zone. In a demand zone, look for bullish imbalances before buying. In a supply zone, look for bearish imbalances before selling.
Does the time frame affect the significance of liquidity zones?
-Yes, higher time frames indicate stronger and more reliable liquidity zones. The larger the time frame, the more significant and impactful the liquidity zone is in predicting price movements.
Outlines

Esta sección está disponible solo para usuarios con suscripción. Por favor, mejora tu plan para acceder a esta parte.
Mejorar ahoraMindmap

Esta sección está disponible solo para usuarios con suscripción. Por favor, mejora tu plan para acceder a esta parte.
Mejorar ahoraKeywords

Esta sección está disponible solo para usuarios con suscripción. Por favor, mejora tu plan para acceder a esta parte.
Mejorar ahoraHighlights

Esta sección está disponible solo para usuarios con suscripción. Por favor, mejora tu plan para acceder a esta parte.
Mejorar ahoraTranscripts

Esta sección está disponible solo para usuarios con suscripción. Por favor, mejora tu plan para acceder a esta parte.
Mejorar ahoraVer Más Videos Relacionados

Best Daily Bias Trading Strategy SMC

HOW TO DRAW PERFECT DEMAND AND SUPPLY ZONES(SUPPORT AND RESISTANCE) IN THE FOREX MARKET

What is Liquidity? - ICT Concepts

Liquidity Sweeps Explained

The only 15 min London killzone trading strategy you need to watch

The 4 Reasons Markets ACTUALLY Move (Draw on Liquidity Explained)
5.0 / 5 (0 votes)
