Excel demo 13 05
Summary
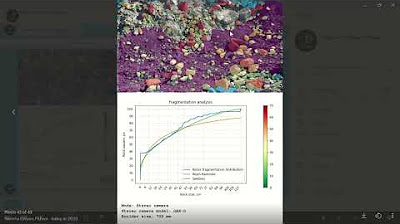
TLDRThe video script introduces a system with a primary artifact, a render, showcasing its capability to detect various classes such as rocks, fine fraction, and exclusion zones. It also provides insights into the current configuration and graphics. Another key artifact is the fragmentation analysis report in Excel, detailing the distribution of rock sizes with 5 cm increments. The report features noncumulative and cumulative percentages of total rock square, correlating with graphics. Users can interact with the system through a web interface to refine detection results by deleting, creating, or improving object outlines.
Takeaways
- 📊 The system produces a render that visually demonstrates how it detects rocks and classifies areas such as fine fraction and exclusion zones.
- 🔍 It provides information on the current system configuration and graphics settings.
- 📈 A fragmentation analysis report is generated in Excel, which is a key output for understanding the system's analysis.
- 📊 Excel report details the distribution of rocks by fractions, with increments of 5 cm.
- 🔢 Column B in the Excel report shows the noncumulative percentage of total rock square, which is a critical metric.
- 🔢 Column C in the Excel report displays the cumulative percentage of total rock square, another important metric.
- 🔗 Both columns B and C correlate with the graphical representation provided by the system.
- 📊 There is also a table showing the percentage of rocks passing through a certain size, which is useful for further analysis.
- 🛠️ The web interface allows users to refine the detection results by deleting, creating, or improving object outlines.
- 🔧 Users can interact with the system to enhance the accuracy of rock detection by adjusting configurations through the web interface.
Q & A
What are the main artifacts of the system mentioned in the transcript?
-The main artifacts of the system are a render and a fragmentation analysis report made in Excel.
How does the system detect rocks and other classes in the render?
-The system detects rocks and other classes such as zones of fine fraction and exclusion zones through its rendering capabilities.
What kind of information can be found in the current configuration and graphics section of the system?
-The current configuration and graphics section provides details about the system's settings and graphical representations of the detected elements.
What is the purpose of the Excel report in the system?
-The Excel report serves as a fragmentation analysis tool, providing detailed information about rock distribution by fractions.
What are the main columns in the Excel report that correlate with the graphics?
-The main columns are B and C, where column B shows the noncumulative percentage of total Rock Square and column C shows the cumulative percentage of total Rock Square, both correlating with the graphics.
How can the Excel report be used to improve detection results?
-The Excel report can be used to analyze the distribution of rocks and make adjustments to the system's detection parameters through the web interface.
What is the 'percentage of passing through' table in the Excel report?
-The 'percentage of passing through' table in the Excel report likely shows the percentage of material that passes through certain size fractions, which is useful for analyzing fragmentation.
How can users interact with the system to improve object detection?
-Users can interact with the system through the web interface to delete, create, or improve objects, thereby enhancing detection results.
What does the term 'fine fraction' refer to in the context of the system?
-In the context of the system, 'fine fraction' likely refers to the smaller particles or smaller size categories of the material being analyzed.
What is an 'exclusion zone' and how does the system identify it?
-An 'exclusion zone' is an area that is not to be considered in the analysis. The system identifies these zones through its detection algorithms and rendering process.
How can the system's configuration be adjusted to improve detection?
-The system's configuration can be adjusted by accessing the web interface, where users can modify settings and parameters to improve the accuracy of object detection.
Outlines

Esta sección está disponible solo para usuarios con suscripción. Por favor, mejora tu plan para acceder a esta parte.
Mejorar ahoraMindmap

Esta sección está disponible solo para usuarios con suscripción. Por favor, mejora tu plan para acceder a esta parte.
Mejorar ahoraKeywords

Esta sección está disponible solo para usuarios con suscripción. Por favor, mejora tu plan para acceder a esta parte.
Mejorar ahoraHighlights

Esta sección está disponible solo para usuarios con suscripción. Por favor, mejora tu plan para acceder a esta parte.
Mejorar ahoraTranscripts

Esta sección está disponible solo para usuarios con suscripción. Por favor, mejora tu plan para acceder a esta parte.
Mejorar ahoraVer Más Videos Relacionados

What Are Igneous Rocks?
Katya's demo video 10.04.24

SAIU A NOVA ATUALIZAÇÃO DO ALBION COM NOVOS EVENTOS, NOVAS ARMAS, NOVO H.O E MUITO MAIS!
Create A Realistic Exterior Render Using D5 Render And PromeAI

I Built the Cheapest AI Personalization System for 50K+ Cold Emails (Costs Revealed)

Mammography Test | Mammogram for breast cancer - What to expect | How to identify breast cancer
5.0 / 5 (0 votes)
