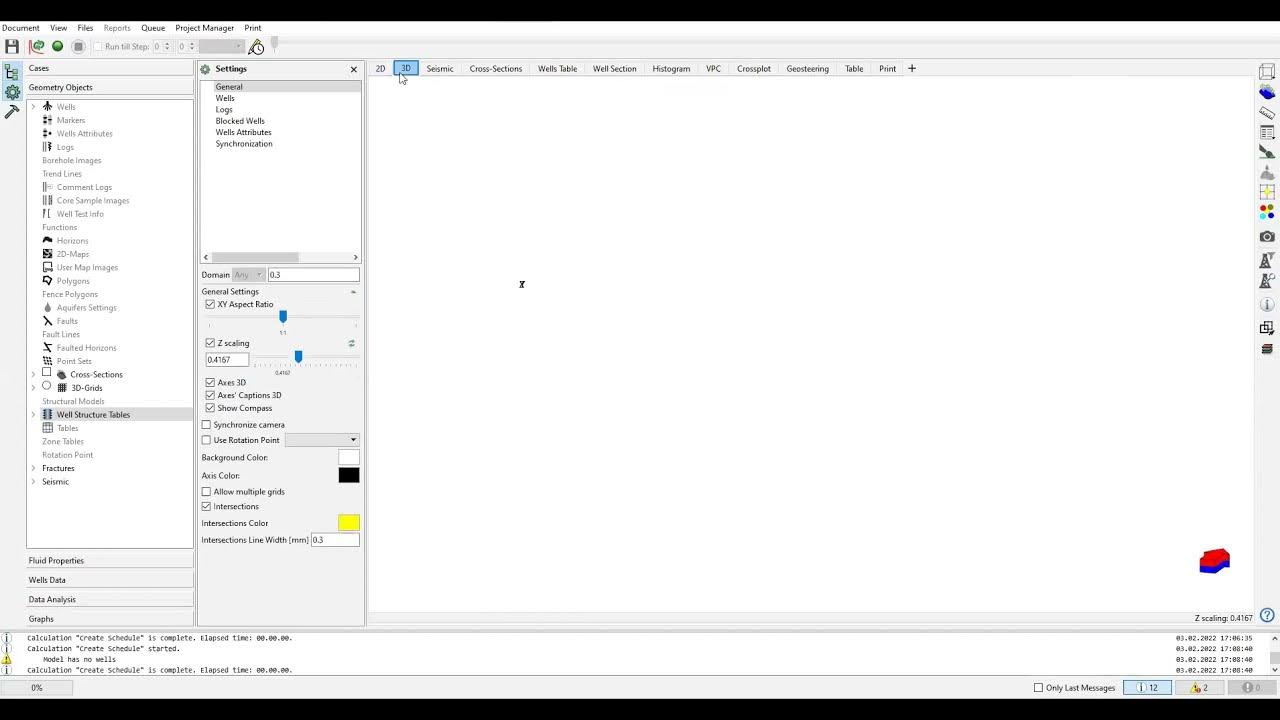
tNavigator 10: Grids, Framework, XYZ Layers
Summary
TLDRThe video tutorial demonstrates the process of using a simulation model, emphasizing the importance of grids for calculation units. It covers maximizing and manipulating windows, displaying grid lines, and working with various layers such as permeability in x, y, and z directions. The tutorial explains how to sum up parameters like permeability across layers, identify areas of high or low permeability, and correlate them with geological data. Additionally, it introduces different viewing modes such as roof, i-j, i-k, and j-k, and highlights the need for multiple permeability direction parameters for accurate modeling.
Takeaways
- 😀 Right-click to close a window and maximize or select the desired window.
- 😀 Grids are essential in models for accurate computational calculations.
- 😀 The grid can be made transparent or show only the framework for clarity.
- 😀 A 2D map can display the roof view, and users can switch between different layers of the model.
- 😀 Summing parameters across all layers helps identify areas with the highest or lowest values, such as permeability.
- 😀 Red areas indicate high permeability, while blue areas represent low permeability in the model.
- 😀 Geological explanations are crucial to understanding why high permeability occurs in specific areas.
- 😀 Different views (e.g., i j view, i k view, j k view) offer various perspectives of the model.
- 😀 The roof view shows the model from the top, while other views focus on different directions (x, y, z).
- 😀 To enhance the model, it's necessary to include permeability data for multiple directions, such as y and z.
- 😀 The script emphasizes the need for understanding the relationship between different layers and parameters in the model.
Q & A
What is the importance of grids in the model?
-Grids are crucial in the model because they serve as the unit for computation. Calculations are made for each grid, which is essential for accurate simulation results.
How can the grid be displayed in the model?
-The grid can be displayed in the model as solid or transparent. You can also choose to show only the framework of the grid without the actual grid lines.
What is the difference between 'roof view' and 'layer view'?
-The 'roof view' shows the model from the top, while the 'layer view' allows you to view the model from different layers, such as layer 1, layer 2, etc. Each layer represents a different part of the model.
What does the summing of parameters across layers signify?
-Summing parameters like permeability across layers helps visualize the total distribution of a specific property across the entire model. For example, summing permeability shows areas with high or low permeability.
Why is permeability shown in color variations like red and blue?
-Permeability is displayed in a color scale where red indicates areas with high permeability and blue indicates areas with low permeability. This helps in easily identifying areas with significant permeability differences.
How do geological explanations relate to permeability variations?
-The geological context can help explain why certain areas have higher or lower permeability. By consulting a geologist, you can understand the geological factors influencing these permeability variations.
What is the significance of the standard deviation in the model?
-The standard deviation helps in understanding the variability or spread of the parameters, such as permeability, across the model. It provides insights into how much the parameter values deviate from the average.
What are the different types of views available in the model?
-The model offers several views: the roof view, i-j view (top-down), i-k view (x-z), and j-k view (y-z). These views help visualize the model from different angles and orientations.
Why is it important to have permeability in multiple directions?
-It is important to have permeability data in multiple directions, such as the x, y, and z directions, to accurately capture the behavior of fluid flow through the material in all dimensions.
What role does porosity play in the simulation?
-Porosity is a key parameter in the simulation as it affects the amount of void space available in the material. This influences fluid flow and other related calculations in the model.
Outlines

Esta sección está disponible solo para usuarios con suscripción. Por favor, mejora tu plan para acceder a esta parte.
Mejorar ahoraMindmap

Esta sección está disponible solo para usuarios con suscripción. Por favor, mejora tu plan para acceder a esta parte.
Mejorar ahoraKeywords

Esta sección está disponible solo para usuarios con suscripción. Por favor, mejora tu plan para acceder a esta parte.
Mejorar ahoraHighlights

Esta sección está disponible solo para usuarios con suscripción. Por favor, mejora tu plan para acceder a esta parte.
Mejorar ahoraTranscripts

Esta sección está disponible solo para usuarios con suscripción. Por favor, mejora tu plan para acceder a esta parte.
Mejorar ahoraVer Más Videos Relacionados

Materi Model Simulasi: Random Variate Diskret: 1.Sebaran Uniform

Getting Started with Simulink, Part 2: How to Add a Controller and Plant to the Simulink Model

tNavigator 7: Importing Rescue File

Pembiasan JFET Self Bias dengan RS

BEDAH PLUGIN YQARCH, GILA SIH AUTO NGEBUT

How to provide axis direction for tilted impeller in ANSYS Fluent 2024 R2 Part 2
5.0 / 5 (0 votes)
