tNavigator 7: Importing Rescue File
Summary
TLDRThis tutorial provides an in-depth walkthrough of a geological modeling software interface, focusing on setting up 3D grids, importing data from external sources like rescue files, and configuring key parameters like permeability, porosity, and well structures. The process includes managing static data, importing existing models, and utilizing various tools for analysis, measurements, and simulations. Users are guided through the steps to prepare data, work with well logs, and fine-tune grid settings, all while emphasizing the importance of accurate fluid properties and model management for effective simulation results.
Takeaways
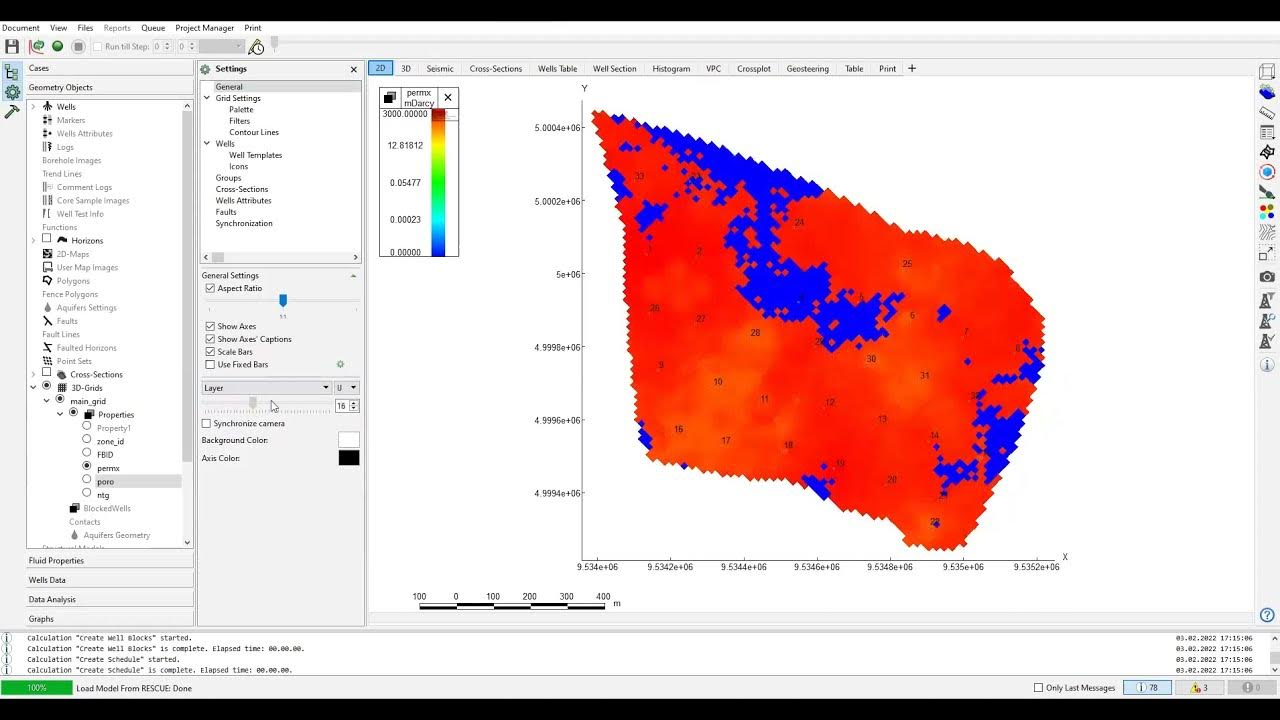
- 😀 The software window includes multiple sections for managing and visualizing data such as geometry, wells, markers, and fluid properties.
- 😀 Users can create and manage various cases, such as 2D maps and 3D models, within the program.
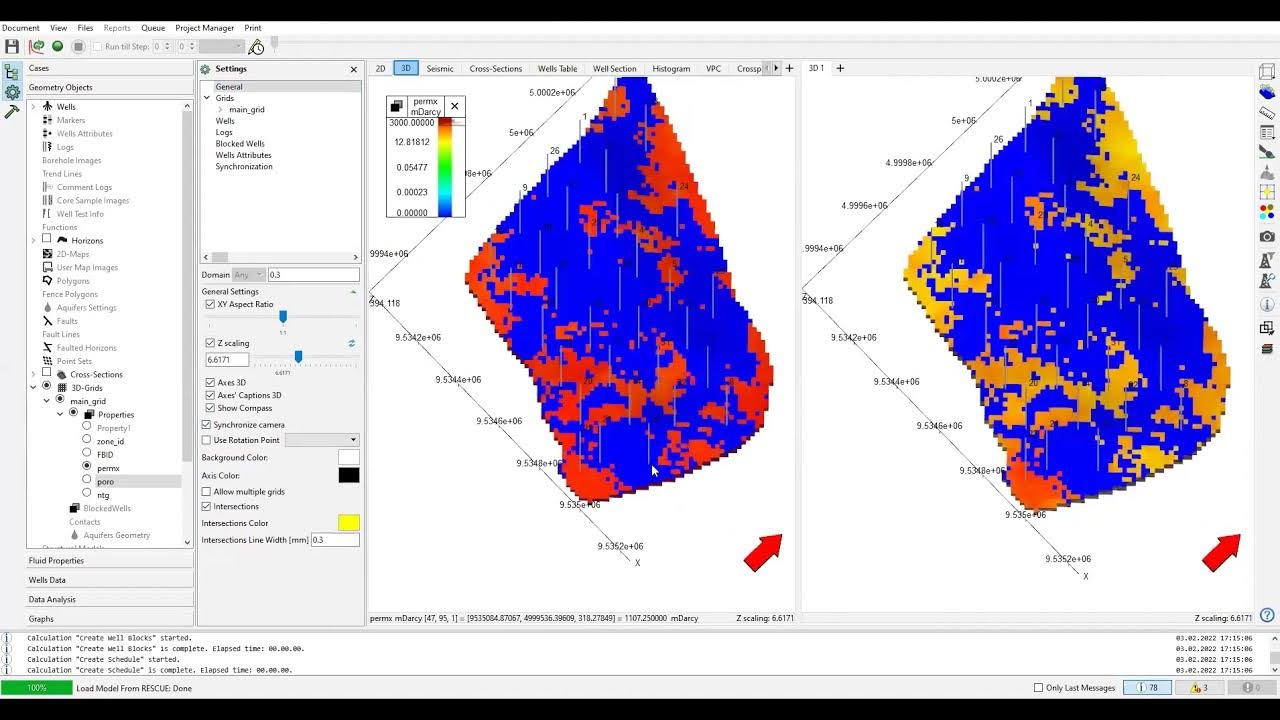
- 😀 Three-dimensional grids, well structure tables, and fluid properties like PVT and compressibility data can be visualized and updated.
- 😀 Essential data for simulation includes relative permeability, PVT data, raw compressibility, and well data, which can be modified and analyzed.
- 😀 Seismic cross-sections, well trajectories, and geosteering tables can be displayed for better visualization and analysis of well data.
- 😀 Data management settings can be adjusted for grids, wells, and other aspects of the model.
- 😀 The software offers tools for creating cross-sections, measuring distances (e.g., between wells), and analyzing statistical data like averages and extremes.
- 😀 The document view section allows users to manage files, projects, and templates, as well as print and share results.
- 😀 Data can be imported from various sources, including rescue files (e.g., Petrel static models) or existing models that require modifications.
- 😀 Importing data from a rescue file allows users to start from scratch, while using an existing model retains pre-existing data and settings.
Q & A
What is the primary purpose of the window discussed in the script?
-The primary purpose of the window is to display and manage various data elements related to the model, such as cases, geometry objects, and well data, which will be used later for simulation and analysis.
What types of data can be visualized within the 3D window?
-Within the 3D window, users can visualize geometry objects, 3D grids, well data, and fluid properties, as well as the perforation history and production history.
What are the different grid-related features mentioned in the script?
-The script mentions the creation of 3D grids and grid settings that will be managed in the window. These grids will be empty at the start and later populated with data from the rescue file.
What is the significance of the 'relative permeability' mentioned in the script?
-Relative permeability is an important parameter for simulation, used in calculating how fluids move through porous media. It is part of the data required for engineering simulations.
How does the software handle data analysis and result plotting?
-The software allows users to perform data analysis, including graphing production history and matching simulation results, which can be plotted for further analysis and interpretation.
What are the options for importing data into the system?
-The system offers two options for importing data: importing from a rescue file (which starts from scratch) or using an existing model file (which contains pre-existing data for further modification).
What is the purpose of importing data from a rescue file?
-Importing from a rescue file allows users to start fresh with a new model by bringing in data from an external source, such as a static model from Petrel, which can then be modified with additional fluid data or dynamic elements.
What is the significance of selecting 'metric' units for the imported grid data?
-Selecting metric units ensures that the coordinates and measurements in the grid file, such as length and well locations, are consistent with the expected units for the modeling process.
What does the 'net to gross' (NTG) parameter represent?
-Net to gross (NTG) is a static parameter that represents the ratio of the effective reservoir rock (net) to the total reservoir rock (gross). It is important for understanding the reservoir's capacity and behavior.
What are the main horizons mentioned, and what is their role in the model?
-The main horizons mentioned are the bottom and top horizons, which define the boundaries of the reservoir. They are important for setting up the grid and understanding the geological layers within the simulation.
Outlines

This section is available to paid users only. Please upgrade to access this part.
Upgrade NowMindmap

This section is available to paid users only. Please upgrade to access this part.
Upgrade NowKeywords

This section is available to paid users only. Please upgrade to access this part.
Upgrade NowHighlights

This section is available to paid users only. Please upgrade to access this part.
Upgrade NowTranscripts

This section is available to paid users only. Please upgrade to access this part.
Upgrade Now5.0 / 5 (0 votes)


