Machine Learning Tutorial Python - 4: Gradient Descent and Cost Function
Summary
TLDRThis script offers an insightful walkthrough of key machine learning concepts, focusing on the Mean Square Error (MSE) cost function, gradient descent, and the significance of the learning rate. The tutorial aims to demystify the mathematical underpinnings often encountered in machine learning, emphasizing a step-by-step approach to grasp these concepts without being overwhelmed. By the end, viewers are guided to implement a Python program that employs gradient descent to find the best fit line for a given dataset, illustrating the process through visual representations and debugging techniques. The practical exercise involves analyzing the correlation between math and computer science scores of students, applying the gradient descent algorithm to determine the optimal values of m and b, and ceasing iterations once a predefined cost threshold is met, showcasing the algorithm's convergence to the global minimum.
Takeaways
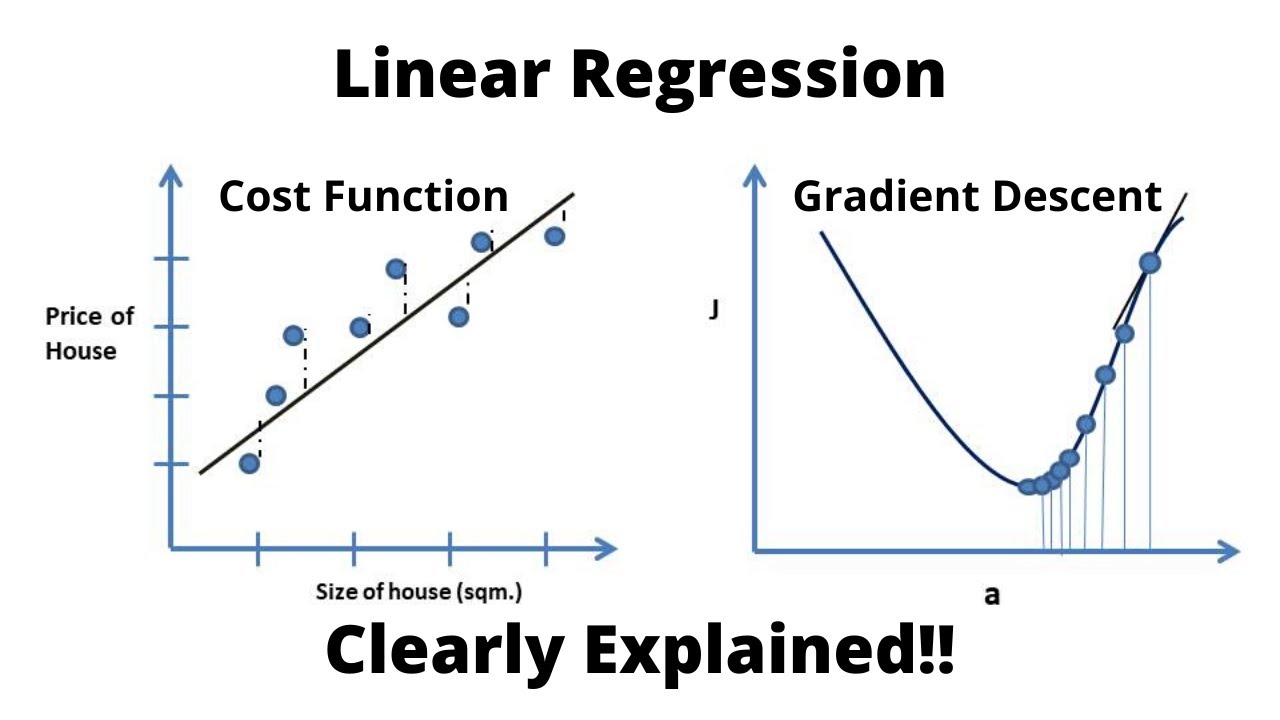
- 📘 Mean Square Error (MSE) is a popular cost function used in machine learning to measure the average squared difference between the estimated values and the actual value.
- 🔍 Gradient descent is an optimization algorithm used to find the best fit line by iteratively adjusting the parameters (m and b) to minimize the cost function.
- 📈 The learning rate is a key parameter in gradient descent that determines the size of the steps taken towards the minimum of the cost function.
- 📉 MSE is calculated as the sum of the squares of the differences between the predicted and actual data points, divided by the number of data points.
- 📊 To implement gradient descent, one must calculate partial derivatives of the cost function with respect to each parameter, which indicate the direction of the steepest increase.
- 🔢 The slope of the tangent at a point on a curve represents the derivative at that point, which is used to guide the direction of the step in gradient descent.
- 🔄 The process of gradient descent involves starting with initial guesses for m and b, then iteratively updating these values based on the partial derivatives and learning rate.
- 🔧 Numpy arrays are preferred for this type of computation due to their efficiency in matrix operations and faster computation speed compared to regular Python lists.
- 🔭 Visualization of the gradient descent process can be helpful in understanding how the algorithm moves through parameter space to find the minimum of the cost function.
- 🔴 The algorithm stops when the cost no longer decreases significantly, indicating that the global minimum has been reached or is very close.
- 🔬 Calculus is essential for understanding how to calculate the derivatives and partial derivatives that are used to guide the steps in gradient descent.
Q & A
What is the primary goal of using a mean square error cost function in machine learning?
-The primary goal of using a mean square error cost function is to determine the best fit line for a given dataset by minimizing the average of the squares of the errors or deviations between the predicted and actual data points.
How does gradient descent help in finding the best fit line?
-Gradient descent is an optimization algorithm that iteratively adjusts the parameters (m and b in the linear equation y = mx + b) to minimize the cost function. It does this by calculating the gradient (partial derivatives) of the cost function with respect to each parameter and updating the parameters in the direction that reduces the cost.
Why is it necessary to square the errors in the calculation of the mean square error?
-Squaring the errors ensures that all errors are positive and prevents them from canceling each other out when summed. This makes it easier to optimize and find the minimum value of the cost function.
What is the role of the learning rate in the gradient descent algorithm?
-The learning rate determines the size of the steps taken during each iteration of the gradient descent algorithm. It is a crucial parameter that affects the convergence of the algorithm; a learning rate that is too high may overshoot the minimum, while a rate that is too low may result in slow convergence or getting stuck in a local minimum.
How does the number of iterations affect the performance of the gradient descent algorithm?
-The number of iterations determines how many times the gradient descent algorithm will update the parameters. More iterations allow for more refinement and potentially a better fit, but they also increase the computational cost. There is a trade-off between accuracy and efficiency that needs to be considered.
What is the significance of visualizing the cost function and the path taken by gradient descent?
-Visualizing the cost function and the path of gradient descent helps in understanding how the algorithm navigates through the parameter space to find the minimum of the cost function. It provides insights into the convergence behavior and can help in diagnosing issues such as getting stuck in local minima or failing to converge.
Why is it important to start with an initial guess for m and b in the gradient descent algorithm?
-Starting with an initial guess for the parameters m and b is important because gradient descent is sensitive to the starting point. Different starting points may lead to different local minima. However, with a well-behaved cost function, gradient descent can find the global minimum if the learning rate is properly chosen.
What are partial derivatives and how do they relate to the gradient descent algorithm?
-Partial derivatives are derivatives of a function with respect to a single variable, keeping all other variables constant. In the context of gradient descent, partial derivatives of the cost function with respect to each parameter (m and b) provide the direction and magnitude of the steepest descent, which is used to update the parameters and 'descend' towards the minimum.
How can one determine when to stop the gradient descent algorithm?
-The algorithm can be stopped when the change in the cost function between iterations falls below a certain threshold, indicating that the parameters have converged to a minimum. Alternatively, one can compare the cost between different iterations and stop when the cost does not significantly decrease, suggesting that further iterations will not yield a better fit.
What is the purpose of using numpy arrays over simple Python lists when implementing gradient descent in Python?
-Numpy arrays are preferred over simple Python lists for their efficiency in performing matrix operations, which are common in gradient descent calculations. Numpy arrays are also faster due to their optimized implementations and support for vectorized operations.
In the context of the tutorial, what is the exercise problem that the audience is asked to solve?
-The exercise problem involves finding the correlation between math scores and computer science scores of students using the gradient descent algorithm. The audience is asked to apply the algorithm to determine the best fit line (values of m and b) and to stop the algorithm when the cost between iterations is within a certain threshold.
Outlines
📚 Introduction to Machine Learning Concepts
The video begins by introducing key concepts in machine learning, such as the mean square error cost function, gradient descent, and learning rate. The speaker aims to demystify the mathematical equations often encountered in machine learning tutorials, encouraging viewers not to be intimidated by their math skills. The tutorial's goal is to implement gradient descent in a Python program, not just to solve a machine learning problem, but to understand the underlying processes for better use of libraries like sklearn. The importance of deriving a prediction function from a dataset is emphasized, using the example of predicting home prices based on area.
📈 Gradient Descent and Its Visualization
The second paragraph delves into how gradient descent operates, a method for finding the best fit line with fewer iterations. A visual representation is provided, plotting m (slope) and b (intercept) against the mean square error to form a 3D surface. Starting from an initial guess, the process involves taking small steps towards the minimum error, adjusting m and b iteratively. The concept of a learning rate is introduced, which, combined with the slope (or derivative), dictates the size of each step towards the optimal values of m and b.
🔢 Calculus and Derivatives in Gradient Descent
The third paragraph explains the role of calculus in determining the steps in gradient descent, focusing on derivatives as a means to calculate slopes. The basic concept of a derivative is introduced, including how to calculate it for a function at a particular point. The distinction between a regular derivative and a partial derivative is made, with examples provided. The video also references the channel '3Blue1Brown' for a more in-depth understanding of these mathematical concepts. Finally, the partial derivatives for m and b in the context of the mean square error function are derived and simplified for practical use in the algorithm.
💻 Implementing Gradient Descent in Python
The fourth paragraph outlines the practical implementation of gradient descent using Python. It begins with initializing m and b, defining the number of iterations, and setting up a loop to perform the iterative process. The loop calculates the predicted y values, the derivatives for m and b, and then updates m and b based on these derivatives and a learning rate. The learning rate is introduced as a key parameter that needs to be fine-tuned. The video also emphasizes the importance of tracking the cost at each iteration to ensure the algorithm is converging towards the correct solution.
🔍 Tuning the Learning Rate and Iterations
The fifth paragraph discusses the fine-tuning of the learning rate and the number of iterations for the gradient descent algorithm. It highlights the importance of monitoring the cost at each iteration to ensure it's decreasing, indicating that the algorithm is making progress. The speaker shares their approach to adjusting the learning rate, starting with a smaller value and increasing it to see the effect on cost reduction. The paragraph also demonstrates how an inappropriately large learning rate can cause the algorithm to overshoot the minimum and start increasing the cost. The goal is to find a balance where the cost continues to decrease with each iteration.
📉 Stopping Criteria and Application Exercise
The final paragraph introduces the stopping criteria for the gradient descent algorithm, which involves comparing the cost between iterations to a predefined threshold. The video uses a tolerance level to determine when the algorithm has converged sufficiently. It also presents an exercise for the viewer, which involves applying the gradient descent algorithm to find the correlation between math and computer science scores of students. The exercise aims to give practical experience in implementing and adjusting the gradient descent algorithm to achieve the best fit line for the given dataset.
Mindmap
Keywords
💡Mean Square Error (MSE)
💡Gradient Descent
💡Learning Rate
💡Linear Regression
💡Cost Function
💡Partial Derivative
💡Intercept (b)
💡Slope (m)
💡Training Data Set
💡Python Programming
💡Jupyter Notebook
Highlights
Mean square error cost function, gradient descent, and learning rate are fundamental concepts in machine learning.
The tutorial aims to demystify mathematical equations in machine learning and build a Python program for gradient descent.
Machine learning involves creating a prediction function from a dataset, unlike traditional linear algebra where equations are given.
The best fit line is derived from the dataset, representing the optimal equation for predicting future values.
Mean square error (MSE) is calculated by summing squared differences between actual and predicted data points, then dividing by the number of data points.
Gradient descent is an efficient algorithm for finding the best fit line with fewer iterations.
A visualization of the gradient descent process is provided to understand how m and b values are iteratively adjusted to minimize error.
The learning rate is a critical parameter in gradient descent, determining the step size towards the minimum error.
Derivatives and partial derivatives are essential for calculating the slope of the cost function at a given point.
The partial derivatives of m and b with respect to the cost function guide the direction of the next step in gradient descent.
Python code is used to implement gradient descent, using numpy arrays for efficient matrix operations.
The number of iterations and the learning rate are parameters that need to be fine-tuned for optimal performance.
Monitoring the cost at each iteration is crucial to ensure the algorithm is converging towards the global minimum.
The learning rate should be adjusted to ensure the cost is consistently decreasing, avoiding overshooting the minimum.
Gradient descent can be stopped when the cost between iterations falls below a certain threshold, indicating convergence.
A practical exercise is provided to apply the gradient descent algorithm to find the correlation between math and computer science scores.
The exercise involves using the gradient descent algorithm to determine the best fit line for predicting computer science scores from math scores.
The tutorial concludes with a discussion on stopping criteria for the gradient descent algorithm based on cost convergence.
Transcripts
mean square error cost function gradient
descent and learning rate
these are some of the important concepts
in machine learning
and that's what we are going to cover
today at the end of this tutorial we
would have written a python program
to implement gradient descent now when
you start going through machine learning
tutorials
the thing that you inevitably come
across is mathematical equations
and by looking at them the first thought
that jumps into your mind is oh my god i
suck at math i used to get 4 out of 50
in my math test
how am i going to deal with this let's
not worry too much about it
we can take one step at a time and the
things won't seem that much hard
also you won't be implementing gradient
descent
when solving the actual machine learning
problem
but the reason we are doing this
exercise today is that
you should know some of the internals so
that while using the sklearn library
you know what's going on and you can use
the libraries in a better way
with that let's get started during our
linear algebra class
in our school days what we used to have
was this equation
and x as an input and we used to compute
the value of y where the way you derive
9 is by multiplying this 3 with 2
which will be 6 plus 3 and that's how
you come up with 9.
in case of machine learning however you
have observations or training data set
which is your input and output
using that you try to derive an equation
also known as prediction function so
that you can use this equation
to predict uh future values of
x in case of
our problem of predicting home prices
we saw in the initial linear regression
tutorials that
we have area and price and using that we
came up with this equation now if you
don't know
this equation quite well you look at my
jupiter notebook
and in that notebook you'll see that i
have
this coefficient and intercept okay
so that's what i have put it here
so here i have the home prices in monroe
township
and i have plotted these on this chart
and what we are going to look at is
how can you derive this equation
given this input and output okay so
our goal is to derive this equation that
equation is nothing but
this blue line which is the best fit
line
uh going through all these data points
right now these data points are
scattered so it's not possible to draw
the perfect line but you try to draw a
line which which is
kind of a best fit all right but
the problem here is you might have
so many lines right that can pos
potentially go through these data points
my data set is very simple here if you
have
uh like very heavy data set and if it's
it's like scattered all over the place
then drawing these lines
becomes even more difficult so how do
you know
which of these lines is the best fit
line
okay so that's the problem that we are
going to solve today
so one way is you draw any random line
then from your actual data point
you calculate the error
between that data point and the data
point predicted by your line
okay so call it a delta you collect all
these deltas
and square them the reason you want to
square them
is these deltas could be negative also
and if you don't square them and just
add them then the results might be
skewed
after that you sum them up and divide it
by
n so n here is five it is number of data
points that you have available
the result is called mean square error
okay and mean square error is nothing
but
your actual data point minus the
predicted data point
you square it sum them up and then
divide by
n this mean square error
is also called a cost function there are
different type of cost function as well
but
mean square error is the most popular
one
and here y predicted is replaced by mx
plus b because you know that y is equal
to mx plus b
so that's the equation for mean square
error
now we initially saw that there are so
many different lines that you can draw
you're not going to try every
permutation and combination of
m and b because that is very inefficient
you want to take some efficient approach
where in very
less iteration you can reach your answer
okay and gradient descent is that
algorithm that helps you
find the best fit line in
very less number of iteration or in a
very efficient way
okay so we are going to look at how
gradient descent works now
for that i have plotted m b
against the mean square error or a cost
function
uh so here i have drawn different values
of
m and here there are different values of
p
which is your intercept and for
every value of m and b you will find
some cost so if you
keep on plotting those points here and
if you create a
plane out of it it will look like this
it will be like a ball
and what you want to do is you want to
start with
some value of m and b people usually
start with zero so here you can see
this point has m is zero and b is zero
and from that point you calculate the
cost so let's say the cost is
thousand then you reduce the value
of m and b by some amount and we'll see
what that amount is later on so you take
kind of like a mini step
you come here and you will see that the
error is now reduced to
somewhere around 900 something like that
and then again you reduce it by taking
one more step you keep on taking these
steps
until you reach this point which is
your minima here
the error is minimum and once you reach
that you have found your answer
because you will use that m and b
uh in your prediction function
i have plotted these different lines and
these different lines will have
different values of m and b
let's say this orange has m1 b1 so that
m1 b1 will be here somewhere
blue line will have m2 b2 m2 b2 will be
this red dot
then red line will have m3 b3 so m3 b3
will be somewhere here on this plot so
you can have like so many numerous lines
which can create this uh plot
now we just said that you will take this
baby step but how exactly you do it
because visually it sounds easy but
mathematically
when you give this task to your computer
uh
you have to come up with some concrete
approach all right
so we'll look into that but
here is the nice visualization of uh
how you can reduce your m and b
and reach the best fit line okay all
right
so let's look at how you're going to
take those baby steps
so i have these two charts uh if you
look at this 3d
plot from this direction what you will
see is a chart of
b against cost and that will be
this curvature similarly if you look at
this chart
from this direction the chart will look
something like this
and in both the cases you are starting
at this point which is this star
and then taking these many steps
and trying to reach this minimum point
which is this red dot
now how do you take these steps
right so one approach is let's say you
take
fixed size steps so here if you plot
this
against b i'm taking fixed size steps on
b
but the problem that it can create is by
taking these steps i
might miss the global minima okay i
might just miss it
and my gradient descent will never
converge it
from this point it will just start going
up and up and i don't know
where is my minima all right so this
approach is not going to work
what can work is if you take steps like
this
so here in each step i am following the
curvature
of my chart and also as i
reach near to my red point you can see
that
the step size is reducing you see like
this arrow is bigger and these arrows
are getting smaller and smaller
if i do something like this then
i can reach this minima now how do i do
that
so at each point you need to calculate
the slope
okay so for example at this point the
slope will be this this is a tangent
at the curvature and at this point here
my slope will be this
once i have a slope i know which
direction i need to go in for example
if you look at this green line and if
i'm at this blue dot
i know that i need to go in this
direction
and then there is something called a
learning rate which you can use
in conjunction with this slope here
to take that step and reach the next
point
now we have to get into calculus a
little bit
because calculus allows you to
figure out these baby steps and
when we are talking about these slopes
really this slope is nothing but a
derivative of
b with respect to this cost function
okay if you want to go in details i
recommend this channel three blue
one brown this guy is very good in
explaining mathematical concept
using a nice visualization so you will
really find it very useful
and pleasing but if you don't want to go
in details then
in this tutorial i'll just quickly walk
over some of the basic concepts okay
let's look at what is derivative so
derivatives is
all about slope i'm on this uh
website called math is fun and these
guys have explained it really well
so slope is nothing but a change in y
divided by change in x
okay so if you have line like this and
if you want to calculate slope between
the two points here
it is 24 divided by 15 but what if you
want to calculate the slope
at a particular point right like in our
case if you remember
here we want to calculate a slope at a
particular point
same thing here right so that slope
will be nothing but a small change in y
divided by small
change in x all right
we'll say as
x shrinks to 0 and y shrinks to 0
that's when you get more accurate slope
okay so for the equation like x square
that slope will be 2x okay
this is again called a derivative
derivative
is mentioned by this notation d by dx
and the derivative of x square is 2x
so for example for this chart the slope
here
is 4 because this is x square
and and the value here for the slope
will be
4. okay now let's look at what is
partial derivative when you have an
equation like this
where you have your function depending
on
two variables x and y what you try to do
is
you calculate a partial derivative of x
in that case you keep the y zero so here
f dot x is nothing but a partial
derivative
of x square with respect to
x okay similarly
when you want to calculate a partial
derivative of this function
with respect to y what you do is
you keep x 0 and then you
calculate the derivative of y all right
and general
rule here is let's say if you're a y
cube right
like how did you come up with 3y squared
like you put
3 here in front of y and then you
subtract 1
from 3 so that's how you get 3y square
okay so those are like some of the basic
concept of
our derivative and partial derivatives
again if you want to go in detail
just follow a three blue one brown a
youtube channel
and that guy is like really good in
explaining these concepts in detail
okay so just to revise the concept the
derivative of this function
uh will be 3 x square and this is the
notation
for your derivative the derivative of
functions which has dependency on two
variables
it will be a partial derivative and the
partial derivative of this function with
respect to
x will be this and with respect to y
will be 2y
and this is how you mention your
derivative this is the notation that you
use
right it's short of like looks like a d
but it's not like it's like a curve d
so now going back to our
problem of
the line right so here we want to find
the partial derivative of b and then for
the other charge we want to find the
partial derivative of
m okay so how do you find that so this
is your mean square
error function and the partial
derivative of
m will be this and partial derivative of
b
will be this now i'm not going to go in
detail about
how we came about this again you can
follow other resources
but you can just accept this equation
it's sort of like a rule you know it's
like uh
why earth rotates around the sun or why
humans have two eyes
well it's just the law of nature but if
you want to go in detail on how we
derived this then you can follow some
other resources but one hint i can give
you is see
this thing has a square so generally for
a derivative you put
2 here so 2 cam here and this becomes
2 minus 1 which is 1 so which we don't
uh
show here all right and then once you
have partial derivative
what you are having is a direction so
partial derivatives
gives you a slope and then once you have
direction now you need
to take a step so for the step you use
something called
learning rate all right so you have
initial value of m
and then you subtract this much your
learning rate into slow
so for example you are here on this
chart this is your b1 value
to come up with this b2 value you will
subtract learning rate multiplied by
the partial derivative which is nothing
but a slope here
now let's write python code to implement
gradient descent
i'm going to use pyjam today instead of
jupiter notebook because i'm planning to
use some of the debugging features
pyjamas community edition is a freely
available to download from
jetbrains website the problem we are
solving here
is we have a value of x and y vectors
and we want to derive uh the best fit
line
or an equation using m and b
so you have x x and y and you want to
come up with correct value of m and b
all right so that's our objective
here i'm going to use a numpy array
instead of
simple python list because matrix
multiplication
is very convenient with this and also
numpy array tends to be
more faster than simple python list
so the first thing we are going to do is
start with
some value of m current and b current
right so again to revise the theory
you start with some value of m and b and
then you take these baby steps
to reach to a global minima so as you
can see in the chart we started
with m and b values as being zero
and then we took these steps one by one
to reach the global minimum another
thing you need to do
is define the number of iterations
you have to define how many baby steps
you are going to do i'm going to start
with 1000
and then i will fine tune it okay again
all of this is
pretty much like a trial and error i
will start with some parameters and i
will see how my algorithm behaves
and then i will fine tune them all right
so
let's run a for loop simple for loop
which just iterates these many
iterations
and at each step what you do is
first thing is you calculate
the predicted value of y all right so y
predicted
is nothing but m current
into x plus b current
all right pretty straightforward y is
equal to mx plus b
and for the assumptions that you have
for
m and b you are calculating y which is y
predicted
next step is to calculate
m derivative and b derivative so m
derivative i'm going to call it
md and the equation
is 2 by n all right now what is n
n is the length of these data points
i'm assuming x and y's length is same
if it is not the case then you can add
necessary validation
and throw an error all right
so the m's derivative is minus 2 by n
multiplied by sum of something
what is that sum sum is
x multiplied by
y minus y predicted okay so y
minus y predicted
and b's derivatives equation is
same except the fact that it doesn't
have this x multiplication
once you have that you're going to
adjust
[Music]
your m current as shown in the equation
uh your next m will be your current m
minus learning rate into uh
m derivative so we have m derivative
but we need learning rate
okay so i'm going to define
learning rate now
okay again this is a parameter that you
have to start with some value
so i'm going to start with point zero
zero
one uh people generally start with zero
zero
one and then they gradually improve it
you can remove
zeros you can
you can use like five whatever this is
like
trial and error you see how your
algorithm behaves and then you tweak
those parameters
similarly for b
the equation is your value of b is
b minus learning rate
into your
partial derivative and then
at each eye iteration i will print their
values
let me print iteration also so that i
know
what's going on at each iteration
okay all right so
looks like my code is good enough and
i can just run it so right click
and run it okay
so let's see what happened
so you can see that we started with some
value of
m and b and now
in the end
we are 2.44 and 1.38
okay now if you want to know
how well you are doing you need to print
cost
at each iteration you should be reducing
your cost
right so if you remember that 3d diagram
at each step you should be reducing your
cost sometimes if you don't write your
program well and if you start increasing
the cost
then you are never going to find the
answer so let's
print cost so what is our cost cost
is equal to if you check the equation it
is 1 divided by
n multiplied by
sum of something and that something is
all the data point differences between y
and y predicted
and their square so we need a list here
and the value in each of the
the list element is this
you will run a for loop
on for value in
y minus y predicted and i'm using a list
comprehension here
and for each of these values you want to
take their square and this is to deal
with the negative values
after that i will print
the cost at each iteration
and when i run this i can now track down
the cost you can see the
cost is reducing in each of these steps
now how do i know when i need to stop
so i can keep on increasing my
iterations
and you can see that i am getting closer
and closer to my expected m and
b value which is two and three
you can also manipulate your learning
rate so what i usually like to do
is first i will keep the iterations less
i will start with some learning rate and
i will see if i am reducing the cost on
each iterations
so here with this learning rate i can
see that i am reducing my cost
okay so i can maybe take even
a bigger step so i will do
probably zero and let's see what happens
with that
now here yes so uh
with that also i am reducing my cost
so i think this is fine let me try one
more
bigger step which is
this
now you can see that i started
increasing my cost
so this learning rate is too big i am
crossing my global minima and i am
shooting in the other direction so i
have to
be between point zero one and point
one so how about point zero nine
there also i'm increasing so maybe
0.08
okay that looks good here i'm reducing
all right so i
i will stick with this learning rate and
increase my iterations
to let's say 10 000
you can see that now i reached my
optimum value the expected value of m
was 2 and b was 3 so which is
almost near to 3 and you can see the
cost is
very minute this is how
you can approach your gradient decent
algorithm and stop
whenever you reach some threshold of
cost or even
you can compare the cost between
different iteration
and you can find out see the the
property of this
uh curvature is that once you reach the
global minima your cost will kind of
stay the same okay if you're using the
correct learning rate
so here you see on in all these
iteration your cost is almost
remaining constant so you can use uh
[Music]
com floating point comparison and just
compare to cost
and stop whenever your cost is
not reducing too much
i also have a visual representation of
how my m and b is
moving towards the best fit line so we
started here
and then we gradually we were moving
closer through those points
though those red points are not quite
visible but they are here here
and you can see that gradually i am
reaching
more and more closer towards those
points so you can use this jupyter
notebook
for a visualization purpose and now
we'll move into
our exercise section so the problem that
you have to
solve today is you are given
the mathematic and computer science test
course for
all these students and you have to find
out the correlation between the math
score and computer science score
so in summary b is your x
and computer science score which is
column c
as your y using this
uh you will find a value of m and b
by applying gradient decent algorithm
and what you have to do is you have to
compare the cost between each iteration
and when it is within certain threshold
and to compare the threshold we are
going to use
a math dot is close function and use a
tolerance of
1 e raised to minus 20
okay so if your two costs are
in this range then you have to stop your
for loop and you have to tell me
how many iteration you need to figure
out
the value of m and b
Ver Más Videos Relacionados
Gradient Descent, Step-by-Step
Linear Regression, Cost Function and Gradient Descent Algorithm..Clearly Explained !!
Deep Learning: In a Nutshell
Gradient descent, how neural networks learn | Chapter 2, Deep learning
Top 6 ML Engineer Interview Questions (with Snapchat MLE)
What is backpropagation really doing? | Chapter 3, Deep learning
5.0 / 5 (0 votes)