Kuliah Statistika Terapan - Pemusatan Data Sesi 1 Ep.04
Summary
TLDRIn this engaging statistics lecture, the host introduces key concepts such as mean, mode, and median, explaining their calculations with clear examples. The video emphasizes how to find these measures for both raw and grouped data, using frequency distribution tables. The relationship among mean, mode, and median is illustrated through graphical representations of data distributions, highlighting how they interact in symmetric and skewed cases. Viewers are encouraged to stay tuned for the next session on quartiles, deciles, and percentiles, making learning statistics both accessible and enjoyable.
Takeaways
- 😀 The video focuses on central tendency measures, including mean, mode, and median, familiar topics for viewers.
- 😀 Viewers are encouraged to subscribe and engage with the channel for future content.
- 😀 The session is divided into two parts, with this first part covering mean, mode, and median, while the second part will discuss quartiles, deciles, and percentiles.
- 😀 The mean is defined as the average of a data set, calculated by summing all values and dividing by the number of data points.
- 😀 When calculating the mean for grouped data, the midpoint of each class interval must be determined before applying the formula.
- 😀 Mode is explained as the most frequently occurring value in a data set, with a specific formula provided for grouped data.
- 😀 The median is described as the middle value of an ordered data set, and its calculation involves determining the appropriate class interval based on frequency.
- 😀 The relationships between mean, mode, and median are discussed, highlighting how their values can indicate the symmetry or skewness of the data distribution.
- 😀 The presenter emphasizes the importance of hygiene by reminding viewers to wash their hands before continuing the video.
- 😀 The session concludes with a reminder to stay tuned for the second part, where additional statistical measures will be discussed.
Q & A
What is the main topic of the video?
-The video discusses the concept of data centralization, focusing on mean, mode, and median, along with an introduction to quartiles, deciles, and percentiles.
How is the mean calculated in a dataset?
-The mean is calculated by summing all the values in the dataset and dividing by the total number of values.
What is the formula for calculating the mean for a sample?
-The formula for calculating the mean for a sample is represented as X̄ = Σx / n, where Σx is the sum of all data values and n is the number of values in the sample.
What does the term 'modus' refer to in statistics?
-Modus refers to the value that appears most frequently in a dataset.
What is the significance of the mode in data analysis?
-The mode helps identify the most common value in a dataset, which can be useful in understanding trends and patterns.
How do you determine the median from a dataset?
-To determine the median, the data must be arranged in ascending order, and the middle value is identified. If there are an even number of observations, the median is the average of the two middle values.
What is the difference between a population and a sample in statistics?
-A population includes all elements from a set, while a sample is a subset of the population used to represent the whole.
How are quartiles, deciles, and percentiles different?
-Quartiles divide data into four equal parts, deciles into ten, and percentiles into one hundred, providing different ways to understand the distribution of data.
What does a symmetrical curve indicate about the mean, mode, and median?
-In a symmetrical curve, the mean, mode, and median are equal and located at the same point.
What is the expected follow-up content in the next video session?
-The next video session will cover quartiles, deciles, and percentiles in detail.
Outlines

Esta sección está disponible solo para usuarios con suscripción. Por favor, mejora tu plan para acceder a esta parte.
Mejorar ahoraMindmap

Esta sección está disponible solo para usuarios con suscripción. Por favor, mejora tu plan para acceder a esta parte.
Mejorar ahoraKeywords

Esta sección está disponible solo para usuarios con suscripción. Por favor, mejora tu plan para acceder a esta parte.
Mejorar ahoraHighlights

Esta sección está disponible solo para usuarios con suscripción. Por favor, mejora tu plan para acceder a esta parte.
Mejorar ahoraTranscripts

Esta sección está disponible solo para usuarios con suscripción. Por favor, mejora tu plan para acceder a esta parte.
Mejorar ahoraVer Más Videos Relacionados
Ukuran pemusatan data, mean median modus, Statistika

Statistika | Video Pembelajaran Matematika Wajib |
ESTATÍSTICA ENEM I MÉDIA, MODA e MEDIANA
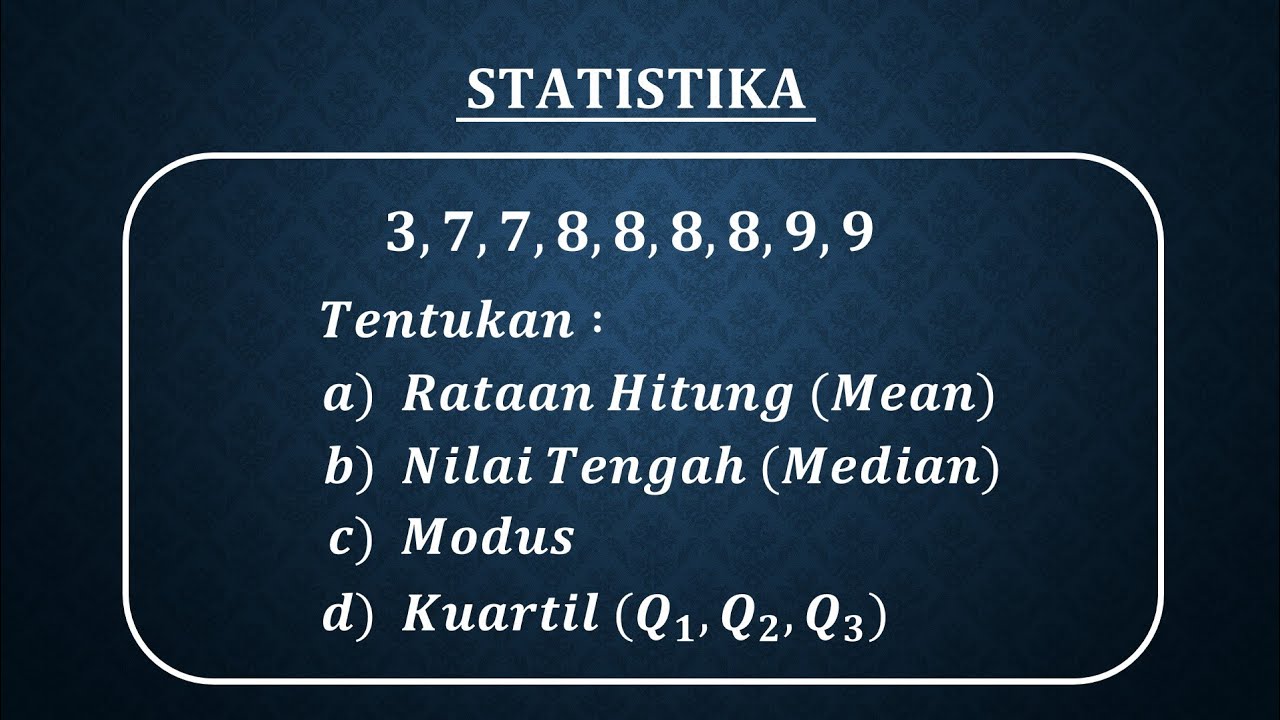
STATISTIKA Tentang Mean, Median, Modus dan Kuartil Data Tunggal

STATISTIKA PART 4 (MEAN, MEDIAN, MODUS)

Statistics: The average | Descriptive statistics | Probability and Statistics | Khan Academy
5.0 / 5 (0 votes)
