Tutorial Prediksi Data Pakai Orange
Summary
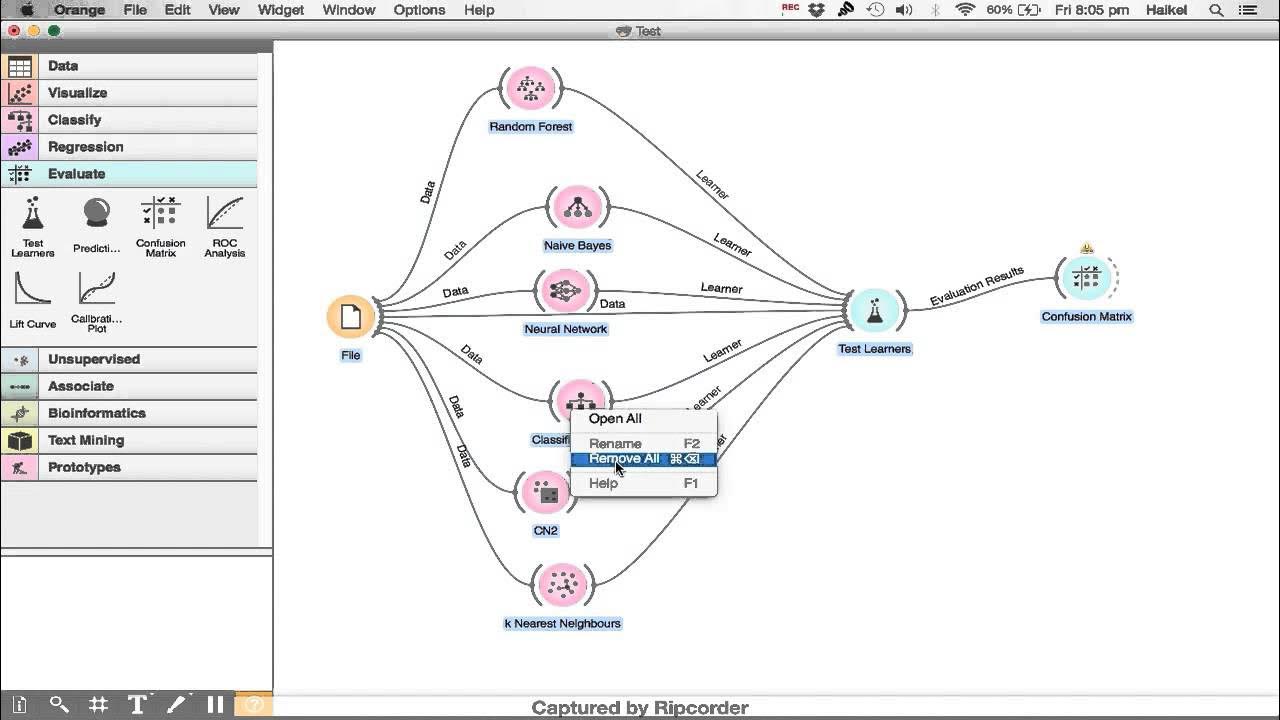
TLDRThis video tutorial explains how to predict data using the Orange software. It begins by guiding users through downloading and installing Orange. The analogy of a kindergarten with students (data) and teachers (training data) is used to explain the concept of data prediction. The tutorial demonstrates importing datasets, setting variables for prediction, and testing models like Neural Networks, Naive Bayes, and Logistic Regression. It emphasizes the importance of selecting the model with the highest accuracy based on prediction performance. The video concludes with a comparison of the models' precision and final recommendations.
Takeaways
- 📥 First, download the Orange software from the provided link and install it by following the 'Next' steps.
- 🏫 Orange software is illustrated as a kindergarten with students and groups, where the students (data) are tested.
- ❓ The unknown data to be predicted is like a question that the students (data) need to solve, which requires prior learning.
- 📊 Training data acts as the teacher, providing the students with examples and answers (labeled data).
- 🧠 Orange uses various learning models, such as neural networks and Naive Bayes, to teach the 'students' how to predict answers.
- 🔍 The models use the training data to make predictions, but predictions may not always be 100% accurate due to mismatches between the model and the data.
- 🧪 The Pima Indians Diabetes dataset is used for demonstration, where the columns represent medical attributes and outcomes.
- 🔄 Data preparation involves dividing the dataset into training and test data, with outcome values removed from the test data for prediction.
- ⚙️ In Orange, users need to specify the target variable (outcome column) for prediction.
- 🔢 Different models (e.g., neural networks, Naive Bayes) provide varying levels of prediction accuracy, and users should choose the one with the highest accuracy, as demonstrated using test scores.
Q & A
What is the main purpose of the video script?
-The video script explains how to use the Orange software to predict data outcomes, particularly for a diabetes dataset.
What is Orange software compared to in the script?
-Orange software is compared to a kindergarten where students (data) are taught by teachers (training data) how to solve problems (predictions).
What are the roles of 'training data' and 'test data' in Orange?
-Training data is used to teach the model by providing data with known outcomes, while test data is used to evaluate the model's ability to make predictions on unseen data.
How does the script describe the process of predicting outcomes with Orange?
-The script describes the process as feeding test data (without known outcomes) into a model trained on training data (with known outcomes) to predict the results, similar to a student using what they've learned to solve a new problem.
What analogy is used for different machine learning models in Orange?
-Different machine learning models in Orange, such as Neural Networks and Naive Bayes, are compared to different teaching methods that help the 'student' (model) learn from the data.
What dataset is used as an example in the script?
-The Pima Indians Diabetes dataset is used as an example to demonstrate data prediction using Orange.
What is the outcome variable in the dataset, and what does it represent?
-The outcome variable is 'outcome,' where 0 represents a negative diabetes result, and 1 represents a positive diabetes result.
How does the script suggest handling test and training data in Orange?
-The script suggests dividing the dataset, using part of it for training (with known outcomes) and another part as test data (with outcomes removed) to predict the results using the Orange software.
What are the models used in the example, and how do they perform?
-The models used are Neural Networks, Naive Bayes, and Logistic Regression. The Neural Network model predicts all outcomes correctly, while Naive Bayes and Logistic Regression have some errors in their predictions.
What is the 'Test and Score' widget used for in Orange, according to the script?
-The 'Test and Score' widget is used to evaluate the accuracy of the models, showing the percentage of correct predictions for each model.
Outlines

Esta sección está disponible solo para usuarios con suscripción. Por favor, mejora tu plan para acceder a esta parte.
Mejorar ahoraMindmap

Esta sección está disponible solo para usuarios con suscripción. Por favor, mejora tu plan para acceder a esta parte.
Mejorar ahoraKeywords

Esta sección está disponible solo para usuarios con suscripción. Por favor, mejora tu plan para acceder a esta parte.
Mejorar ahoraHighlights

Esta sección está disponible solo para usuarios con suscripción. Por favor, mejora tu plan para acceder a esta parte.
Mejorar ahoraTranscripts

Esta sección está disponible solo para usuarios con suscripción. Por favor, mejora tu plan para acceder a esta parte.
Mejorar ahoraVer Más Videos Relacionados
5.0 / 5 (0 votes)


