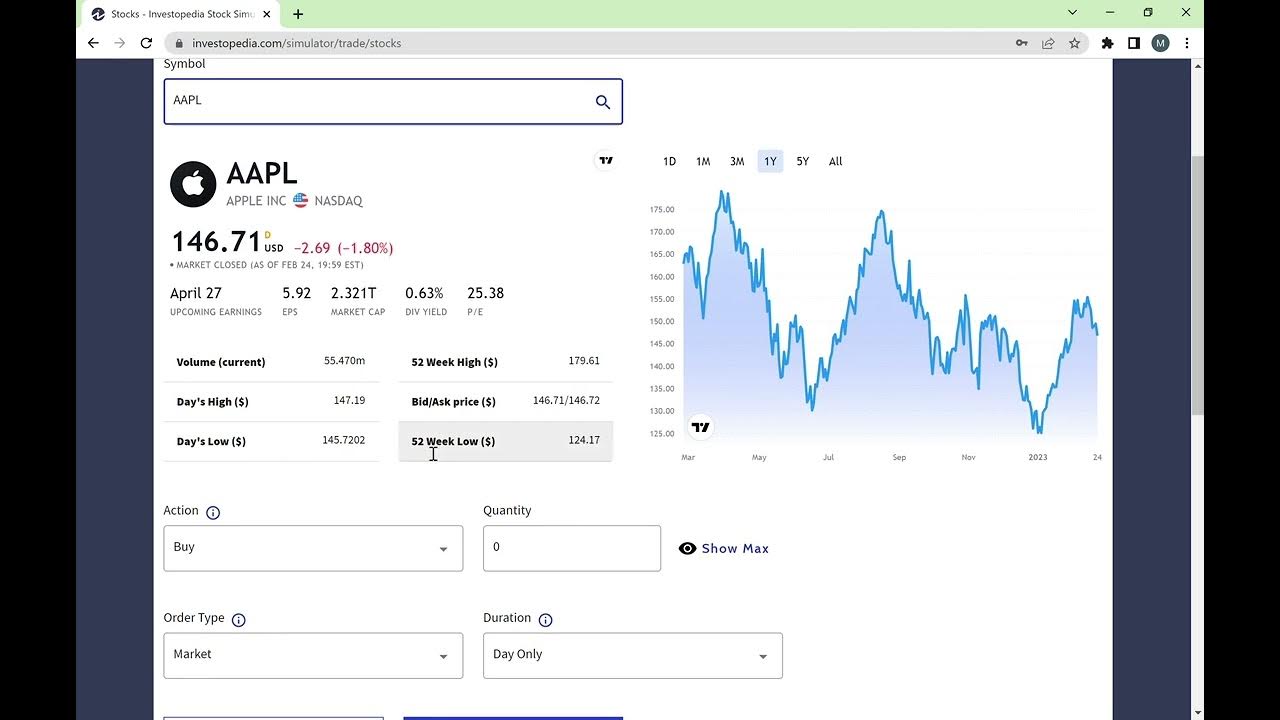
如何用Python對美股自動量化交易, 實戰一個簡單的日內自動交易程序
Summary
TLDRThis video tutorial demonstrates how to automate stock trading using Python with the Interactive Brokers platform. It covers configuring the IB client, acquiring real-time stock data, and implementing a trading bot for intraday strategies. The strategy uses the Hammer candlestick pattern as a signal for entering trades. The presenter also explains how to connect to a free API for real-time stock data, write custom code for pattern recognition, and automate buy/sell actions using market orders. This approach helps automate trading, saving time for users by eliminating manual monitoring of stock charts.
Takeaways
- 💻 The video discusses using Python to connect to Interactive Brokers for automated trading.
- 🔗 The presenter introduces a case study on integrating Python with Interactive Brokers for intraday quantitative trading.
- 🕒 Quantitative trading can help amateur investors who cannot monitor the market all day due to other commitments.
- 📈 The video explains how to use Python to automate trading by connecting to the Interactive Brokers' Trader Workstation (TWS).
- 📊 The presenter uses a free stock data app called Fineharb.io to obtain real-time stock data for quantitative analysis.
- 📈 The script outlines how to use the Fineharb.io API to fetch real-time stock data using Python.
- 📋 The strategy discussed is based on candlestick patterns, specifically the 'hammer' pattern, which signals a potential reversal and upward trend.
- 📈 The hammer pattern is identified by a specific candlestick shape that indicates a strong buying interest after a period of selling.
- 💡 The presenter shares a strategy learned from an Indian trader, focusing on the 'hammer' pattern within a downtrend as a bullish signal.
- 🔧 The video includes a detailed walkthrough of the Python code required to implement the trading strategy using the hammer pattern.
- 🔄 The script describes setting up a loop in the Python code to continuously check for the hammer pattern and execute trades accordingly.
- 📉 The strategy includes setting stop-loss and take-profit levels to manage risk and lock in profits during automated trading.
Q & A
What is the main focus of the video script?
-The main focus of the video script is to demonstrate how to use Python to connect to Interactive Brokers (IB) for automatic trading, specifically for intraday quantitative trading of US stocks.
Why is it beneficial to use a quantitative trading robot?
-A quantitative trading robot is beneficial because it can monitor the market and automatically execute trades on behalf of the investor, ensuring that they do not miss out on trading opportunities due to being occupied with other tasks such as work.
What is the role of the 'Trader Workstation' mentioned in the script?
-The 'Trader Workstation' is a client software from Interactive Brokers that is used to connect to their trading system. It is necessary for the Python scripts to interact with the trading platform.
How does one obtain real-time market data for quantitative trading as described in the script?
-The script suggests using a free API from a platform called 'fineharb.io' that provides one-minute US stock data. This data is used to monitor market conditions for trading strategies.
What is the significance of the 'hammer' candlestick pattern in the trading strategy discussed?
-The 'hammer' candlestick pattern is significant as it indicates a potential reversal and upward trend in the market. It is used as a trading signal to initiate long positions when it appears during a downtrend.
How does the script suggest to handle the execution of trades?
-The script suggests using the Interactive Brokers' API to execute trades. It involves writing a Python script that connects to the trading platform, retrieves real-time data, and places trades based on the defined strategy.
What is the purpose of setting stop-loss and take-profit orders in the trading strategy?
-The purpose of setting stop-loss and take-profit orders is to automate the process of closing positions to lock in profits or limit losses once the trade reaches a predetermined price level.
How often does the trading script check for new trading signals?
-The script checks for new trading signals every ten seconds, as indicated by the 'tm.sleep(10)' command in the script.
What is the significance of the 'hammerbulish' indicator mentioned in the script?
-The 'hammerbulish' indicator is a custom indicator used in the script to identify 'hammer' candlestick patterns, specifically during downtrends, to determine potential reversal points for initiating trades.
Can the trading strategy discussed in the script be applied to other financial instruments besides US stocks?
-Yes, the trading strategy can potentially be applied to other financial instruments such as forex, futures, and cryptocurrencies, as long as the necessary data and trading platform support are available.
What is the advantage of monitoring multiple stocks simultaneously as suggested in the script?
-Monitoring multiple stocks simultaneously increases the chances of finding trading opportunities as the strategy can react to signals across various stocks, rather than focusing on a single stock.
Outlines

Esta sección está disponible solo para usuarios con suscripción. Por favor, mejora tu plan para acceder a esta parte.
Mejorar ahoraMindmap

Esta sección está disponible solo para usuarios con suscripción. Por favor, mejora tu plan para acceder a esta parte.
Mejorar ahoraKeywords

Esta sección está disponible solo para usuarios con suscripción. Por favor, mejora tu plan para acceder a esta parte.
Mejorar ahoraHighlights

Esta sección está disponible solo para usuarios con suscripción. Por favor, mejora tu plan para acceder a esta parte.
Mejorar ahoraTranscripts

Esta sección está disponible solo para usuarios con suscripción. Por favor, mejora tu plan para acceder a esta parte.
Mejorar ahoraVer Más Videos Relacionados
5.0 / 5 (0 votes)


