Graph f(x)=2^x
Summary
TLDRIn this educational video, Shaun Gannon from 'Mid Math' explains how to graph the exponential function f(x) = 2^x. He starts by creating a table of values for x, including negative, zero, and positive integers, to demonstrate the function's behavior. Gannon then plots these points on a graph, illustrating the function's positive nature and its horizontal asymptote at y=0. He discusses the function's domain (from negative to positive infinity) and range (0 to positive infinity), noting it never reaches zero. The video concludes with an analysis of the function's increasing nature, providing a clear visual understanding of the graph.
Takeaways
- 📚 The video is an educational tutorial on graphing the exponential function f(x) = 2^x.
- 📈 The instructor uses a table to demonstrate how to plot points for the function.
- ✅ For x = -1, f(x) equals 1/2, which is 2 raised to the power of negative 1.
- ✅ For x = 0, f(x) equals 1, since any number to the power of zero is 1.
- ✅ For x = 1, f(x) equals 2, and for x = 2, f(x) equals 4, showcasing the function's increase.
- 📊 The graph of the function has all positive y-values, indicating it will never touch or cross the x-axis.
- 🔍 The function has a horizontal asymptote at y = 0, as x approaches negative infinity, f(x) approaches 0.
- 📉 The function's domain is from negative infinity to positive infinity, and its range is from 0 to positive infinity, not including 0.
- 🚫 There is no x-intercept for the function, as it never crosses the x-axis due to the horizontal asymptote.
- ✅ There is a y-intercept at (0,1), which is the point where the graph intersects the y-axis.
- 📈 The function is always increasing, as it goes up from left to right on the graph.
Q & A
What is the function discussed in the video?
-The function discussed in the video is f(x) = 2^x, which is an exponential function.
What is the value of f(x) when x is negative one?
-When x is negative one, f(x) equals 2 to the power of negative one, which is 1/2 or 0.5.
What is the value of f(x) when x is zero?
-When x is zero, f(x) equals 2 to the power of zero, which is 1, because any number to the zero power is 1.
What is the value of f(x) when x is one?
-When x is one, f(x) equals 2 to the power of one, which is 2.
What is the value of f(x) when x is two?
-When x is two, f(x) equals 2 to the power of two, which is 4.
What is the domain of the function f(x) = 2^x?
-The domain of the function f(x) = 2^x is all real numbers, from negative infinity to positive infinity.
What is the range of the function f(x) = 2^x?
-The range of the function f(x) = 2^x is all positive real numbers, from 0 to positive infinity, but it does not include 0 because the function never actually reaches zero.
Does the function f(x) = 2^x have a y-intercept?
-Yes, the function f(x) = 2^x has a y-intercept at the point (0,1), which occurs when x equals 0.
Does the function f(x) = 2^x have an x-intercept?
-No, the function f(x) = 2^x does not have an x-intercept because it never crosses the x-axis.
Is there a horizontal asymptote for the function f(x) = 2^x?
-Yes, there is a horizontal asymptote at y equals 0, as the function approaches 0 but never reaches it as x goes to negative infinity.
Is the function f(x) = 2^x increasing or decreasing?
-The function f(x) = 2^x is increasing because as x increases, the value of f(x) also increases, going up to positive infinity.
Outlines

Esta sección está disponible solo para usuarios con suscripción. Por favor, mejora tu plan para acceder a esta parte.
Mejorar ahoraMindmap

Esta sección está disponible solo para usuarios con suscripción. Por favor, mejora tu plan para acceder a esta parte.
Mejorar ahoraKeywords

Esta sección está disponible solo para usuarios con suscripción. Por favor, mejora tu plan para acceder a esta parte.
Mejorar ahoraHighlights

Esta sección está disponible solo para usuarios con suscripción. Por favor, mejora tu plan para acceder a esta parte.
Mejorar ahoraTranscripts

Esta sección está disponible solo para usuarios con suscripción. Por favor, mejora tu plan para acceder a esta parte.
Mejorar ahoraVer Más Videos Relacionados
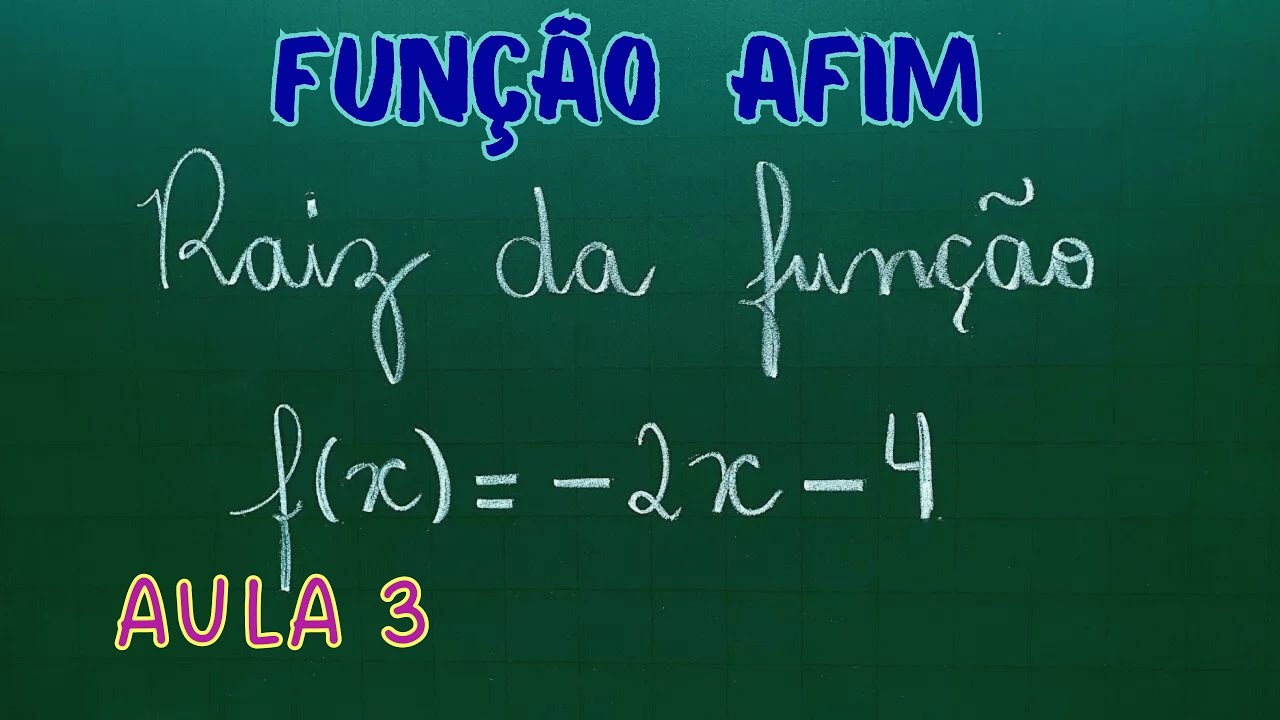
RAIZ DA FUNÇÃO AFIM - Professora Angela Matemática
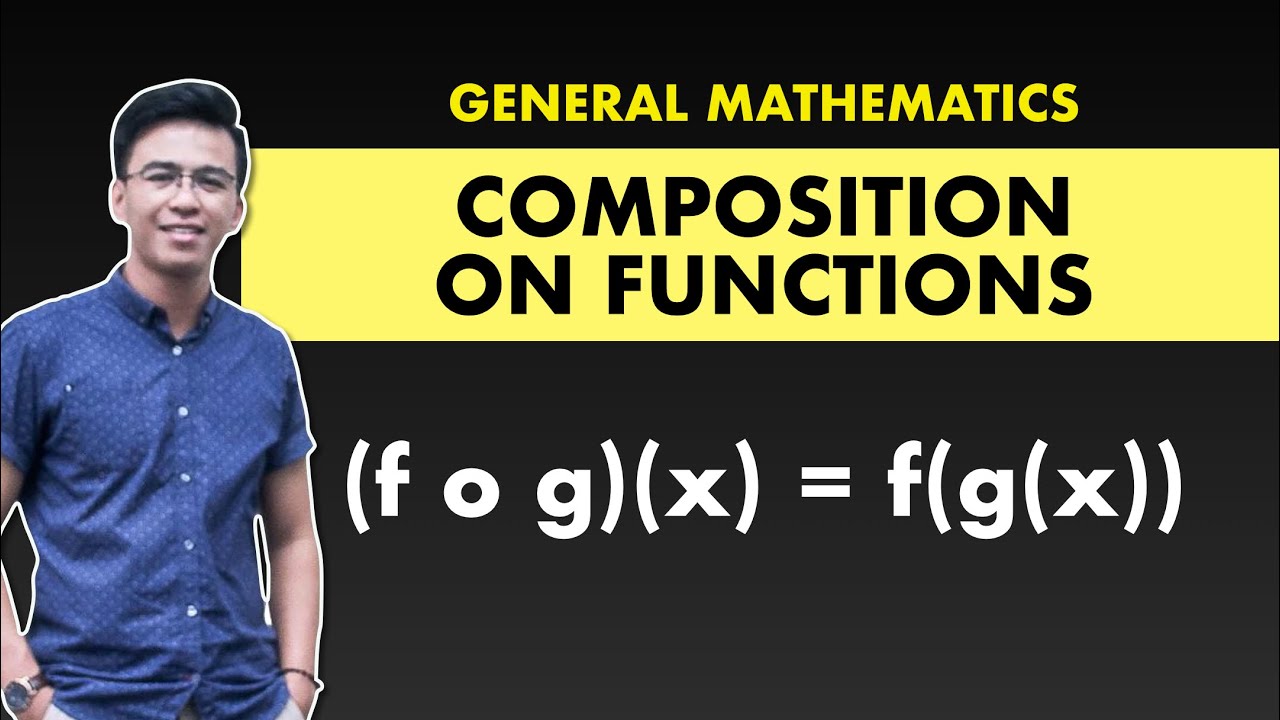
Composite Function | General Mathematics @MathTeacherGon
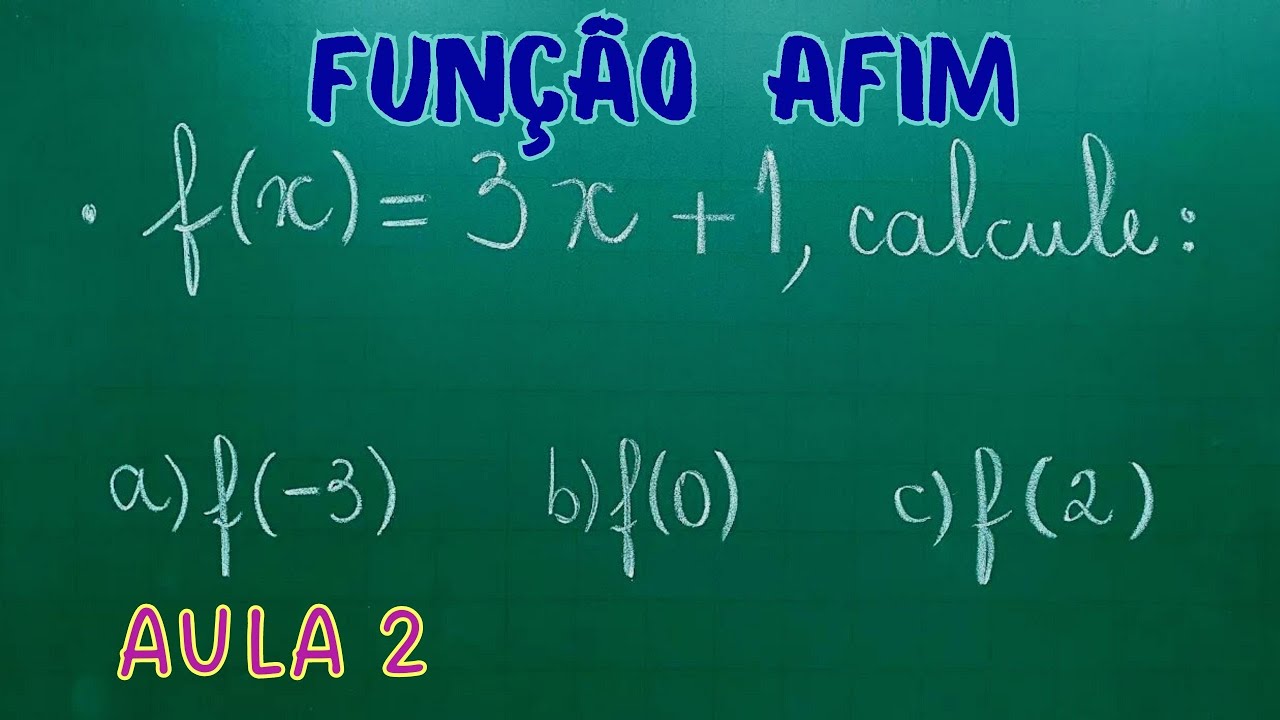
VALOR NUMÉRICO DE UMA FUNÇÃO AFIM - FUNÇÃO DO 1º GRAU - AULA 2 - Professora Angela Matemática

How to find the domain and the range of a function given its graph (example) | Khan Academy
Composition of Functions - Grade 11 - General Mathematics
Evaluate a Piecewise Function | Eat Pi
5.0 / 5 (0 votes)
