Heating Curve Grade 10: Kinetic Molecular Theory
Summary
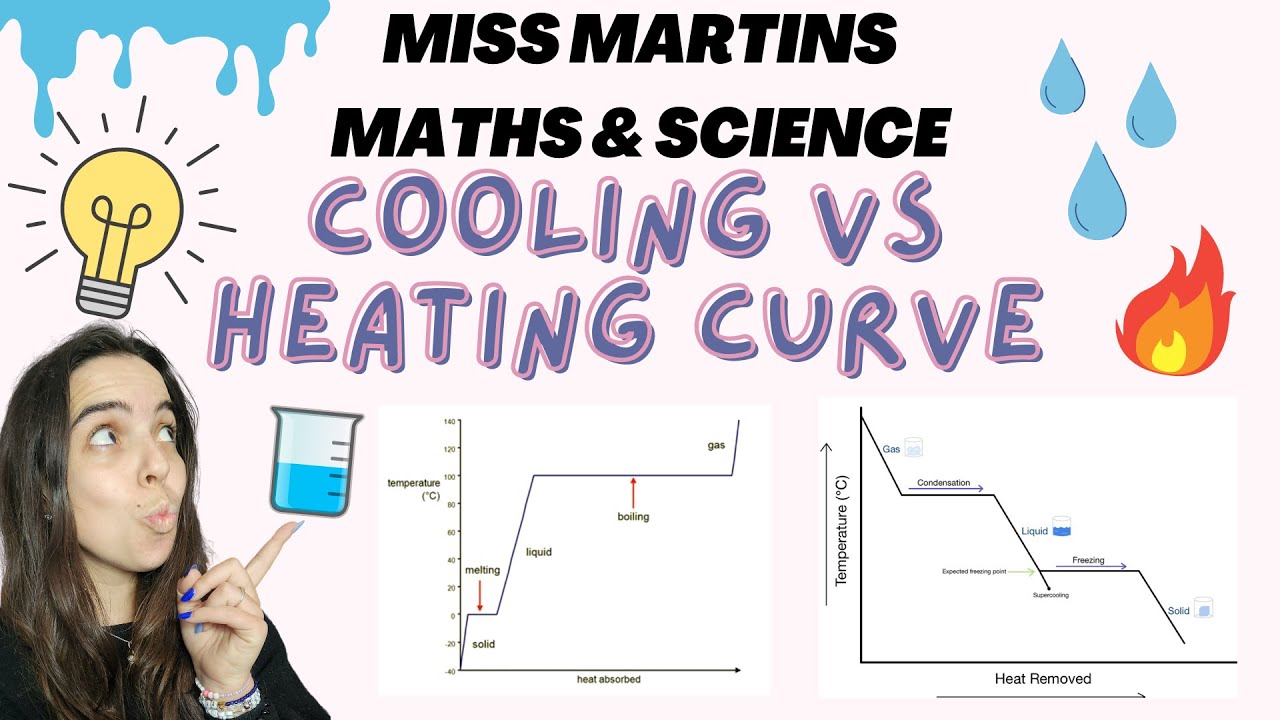
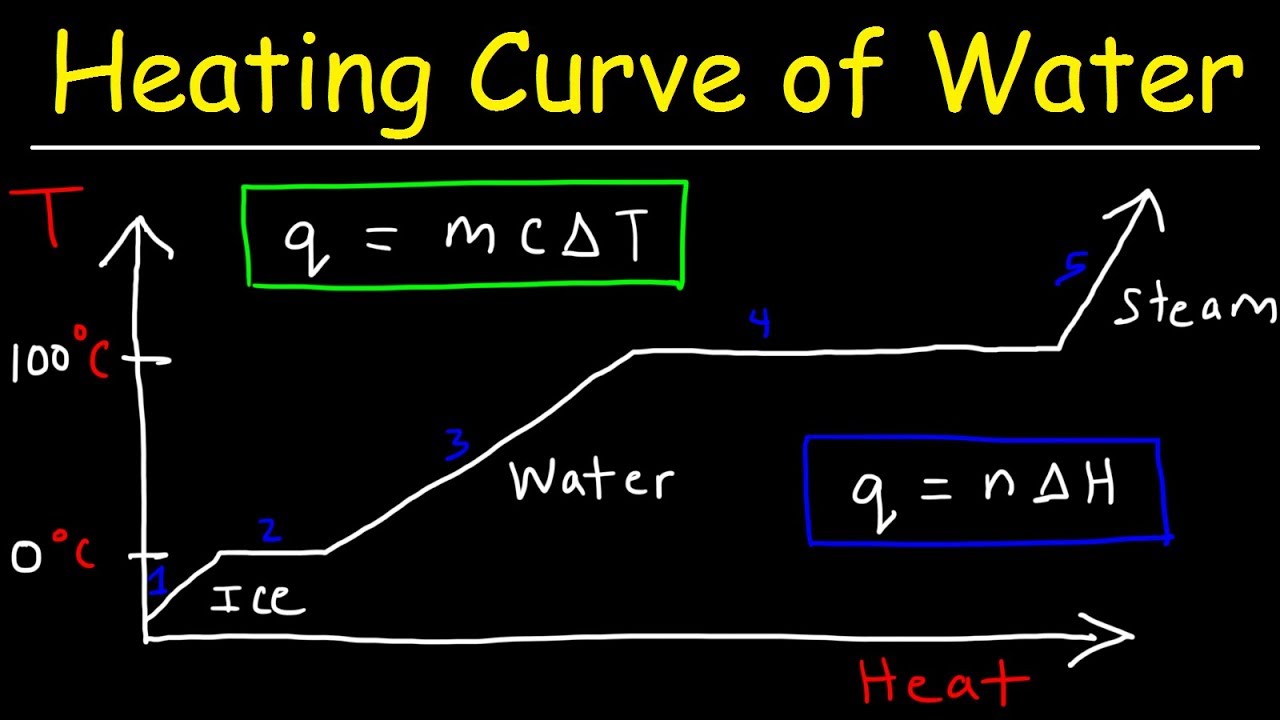
TLDRIn this educational video, Miss Martins explores the kinetic molecular theory's application to heating curves, emphasizing the distinction between heat energy and temperature. She explains that adding heat doesn't always raise a substance's temperature, highlighting phase changes where heat energy is used to overcome intermolecular forces without increasing temperature. The video uses the heating curve of water as an example, illustrating how temperature remains constant during melting and boiling, and encourages viewers to understand the kinetic theory's implications for phase changes.
Takeaways
- 🔥 The kinetic molecular theory explains the behavior of particles in a substance when heat is applied.
- ⏱️ A heating curve is a graphical representation of the temperature change of a substance over time during heating.
- ⚠️ Adding heat to a substance does not always result in a temperature increase; the energy can be used for phase changes.
- 📊 The flat parts of a heating curve indicate a phase change is occurring, where energy is used to overcome intermolecular forces without increasing temperature.
- 💧 The heating curve of water shows distinct phases: solid (ice), liquid, and gas, with phase changes at specific temperatures.
- 🌡️ The melting point and boiling point of a substance are represented by the horizontal sections of the heating curve, where temperature remains constant during phase change.
- 📉 On the heating curve, the inclined parts represent periods where the substance is in a single phase and its temperature is increasing due to added heat.
- 🔍 The axes of a heating curve are crucial, with the y-axis representing temperature in degrees Celsius and the x-axis representing time in minutes.
- 🌟 The kinetic molecular theory states that when a substance is heated, it can either increase in temperature (if in the same phase) or undergo a phase change without a temperature increase.
- 🔄 During phase changes, such as melting (solid to liquid) or boiling/evaporation (liquid to gas), both phases coexist, and the added heat energy is used to weaken intermolecular forces.
Q & A
What is the kinetic molecular theory?
-The kinetic molecular theory is a concept that explains the behavior of particles in a substance when energy is added or removed. It relates to how substances change phases and how their temperature changes with the addition of heat energy.
What is a heating curve and how is it represented?
-A heating curve is a graphical representation that shows the change in temperature of a substance over time as heat is added. It typically has time on the x-axis and temperature on the y-axis.
Why doesn't the temperature of a substance always increase when heat is added?
-The temperature of a substance doesn't always increase when heat is added because the energy can be used for phase changes, such as melting or boiling, where the intermolecular forces are overcome without increasing the temperature.
What is the significance of the flat parts of a heating curve?
-The flat parts of a heating curve indicate that a phase change is occurring. During these periods, the substance absorbs heat energy to change its state without a rise in temperature.
What are the two possible outcomes when heat is added to a substance according to the kinetic molecular theory?
-When heat is added to a substance, the kinetic molecular theory suggests two possible outcomes: an increase in temperature due to increased average kinetic energy, or no increase in temperature as the energy is used to overcome intermolecular forces during a phase change.
Why is it important to label the axes of a heating curve correctly?
-Labeling the axes of a heating curve correctly is important for clarity and accuracy. It ensures that the graph is easily understood, with the y-axis typically representing temperature and the x-axis representing time.
What is the difference between the inclined and horizontal parts of a heating curve?
-The inclined parts of a heating curve represent periods where the substance is in a single phase and its temperature is increasing due to added heat. The horizontal parts indicate phase changes, where the substance is transitioning from one state to another without a change in temperature.
What is the melting point and boiling point of water, and how do they relate to the heating curve?
-The melting point of water is around 0 degrees Celsius, and the boiling point is around 100 degrees Celsius. These points are significant on the heating curve as they mark the transition from solid to liquid (melting point) and liquid to gas (boiling point).
How can you identify the phase or phases present during different parts of a heating curve?
-You can identify the phase or phases present during different parts of a heating curve by observing the inclined and horizontal sections. Inclined sections indicate a single phase, while horizontal sections indicate a phase change where two phases coexist.
What is the role of intermolecular forces in the context of a heating curve?
-Intermolecular forces play a crucial role in a heating curve as they resist changes in the state of a substance. During phase changes, the added heat energy is used to weaken these forces, allowing the substance to transition from one phase to another without an immediate increase in temperature.
Outlines
🔍 Introduction to Kinetic Molecular Theory and Heating Curves
This paragraph introduces the concept of the kinetic molecular theory and its relation to heating curves. The narrator, Miss Martins, explains that a heating curve is a graphical representation of the temperature change of a substance over time when heat is applied. She emphasizes that adding heat to a substance does not always result in a temperature increase, highlighting the distinction between heat energy and temperature. The paragraph sets the stage for a deeper exploration of how heating curves can be used to understand phase changes in substances like water, with specific reference to melting and boiling points.
🌡 Understanding Heating Curves and Phase Changes
In this paragraph, the focus is on the mechanics of heating curves and how they illustrate phase changes. The narrator uses the example of water to explain that during phase changes, such as melting and boiling, the temperature remains constant despite continuous heat input. This is because the added heat energy is used to overcome intermolecular forces, facilitating the transition from one phase to another without a change in temperature. The inclined parts of the heating curve represent periods where the substance's temperature increases due to absorbed heat, while the horizontal parts indicate phase changes where the energy is used to change the state of the substance rather than increase its temperature.
📊 Analyzing Phases and Phase Changes in Heating Curves
The final paragraph delves into the specifics of identifying phases and phase changes from a heating curve. The narrator clarifies that during the flat parts of the curve, two phases coexist as the substance undergoes a phase change. For example, during melting (solid to liquid) and boiling/evaporation (liquid to gas), both the initial and final phases are present. The narrator also invites viewers to request past paper questions for practice and encourages engagement through comments. The summary ends with a call to action for viewers to subscribe, share, and like the video, and expresses well wishes for their studies.
Mindmap
Keywords
💡Kinetic Molecular Theory
💡Heating Curve
💡Phase Change
💡Temperature
💡Heat Energy
💡Intermolecular Forces
💡Melting Point
💡Boiling Point
💡Average Kinetic Energy
💡Phases of Matter
Highlights
Kinetic molecular theory relates to the heating curve, showing the change in temperature of a substance over time.
Heating a substance involves adding energy, but it doesn't necessarily mean the temperature will increase.
The heating curve's flat parts indicate a phase change, where temperature remains constant despite added heat.
The x-axis typically measures time, while the y-axis measures temperature in degrees Celsius.
The heating curve of water is specifically labeled, showing phases and phase changes.
The boiling point of water is 100 degrees Celsius, indicated by the second horizontal part of the curve.
A proper graph should start at the origin, representing zero temperature and time.
The inclined parts of the curve represent when the substance is in one phase, with increasing temperature.
During phase changes, heat energy is used to weaken intermolecular forces, causing a phase change without a temperature increase.
The kinetic molecular theory explains that heating can either increase temperature or cause a phase change.
The horizontal parts of the graph indicate a phase change, where both phases are present.
The inclined parts of the graph show an increase in temperature without a phase change.
The video provides a detailed explanation of how to interpret the heating curve for substance X.
The video emphasizes the importance of understanding the difference between heat energy and temperature.
The video concludes with a call to action for viewers to engage with the content and seek further assistance if needed.
Transcripts
hello everybody and welcome back to
another video with me Miss Martins today
we're going to carry on with the kinetic
molecular theory and in particular we're
going to look at the kinetic molecular
theory and how it relates to the heating
curve now if you haven't watched part
one of the series I suggest you do that
now
as you can see a heating curve is
basically described as a curve that
shows the change in temperature of a
substance during a time period when
heating occurs now the first thing that
I want you to guys to understand is that
when we heat a substance we are adding
energy to the substance we are adding
heat energy to the substance and the
first thing that I want you to get
familiar with right off the bat is the
fact that if I add heat okay I'm adding
heat to the substance that does not
necessarily mean the temperature of the
substance increases so I want you to
understand that there is a difference
between heat
basically in other words for heat in
this context will be energy heat energy
and temperature so if you can see the
curve over here we'll discuss the axes
the hitting and everything
um in a second but you can basically see
that this is a measure of temperature as
time goes on and what's important to
understand is that sometimes the isn't
increasing you can see the flat parts of
the graph like over here this part over
here temperature is not increasing and
this part over here temperature is not
increasing so But as time is going on
I'm adding heat to the substance so
another measure another thing that can
be measured on this axis is actually
time and we are most commonly going to
see time in seconds or time in minutes
being measured on the x-axis and on the
y-axis temperature so let's look more
closely at the heating curve and how it
works as you can see here my heading is
heating curve of water this is showing
water in particular the substance water
another heading for this curve could be
temperature of water versus time in
minutes
as you can see on the y-axis which is
this one we've got temperature measured
in degrees celsius it's very important
when drawing a graph to look and label
your axes correctly with unit so
temperature degree celsius time in
minutes and we've got the curve over
here
now I've labeled this curve I've shown
in yellow this the phases present so
here you can see solid
then we've got solid and liquid then
we've got liquid then we've got liquid
and gas and then we've got gas see my
key OBS is phases in yellow and phase
change in green so you can see the first
horizontal of the graph represents
melting the second represents boiling or
evaporation remember both terms are
applicable and then I've also indicated
the boiling point over here which we
know for water is 100 degrees Celsius we
read it off over here the boiling point
is that where the graph reaches its
second flat it's second horizontal and
this over here
will be the melting point right now what
I want to point out with this graph is
that we've got our y-axis and our x-axis
over here and generally where y-axis and
our x-axis meet if you think of a
Cartesian plane that is the origin which
is a zero zero position over here
they've kind of drawn very strangely and
they started with negative 40. that's
not really how we like to do it so we
like to draw our graphs looking more
like this
as you can see this is the y-axis
this is the x-axis
temperature versus time and we can see
here where those two axes cross that is
the origin it's the zero position if I
temperatures below zero we generally
draw it below the x-axis like this so
for example this would be negative 100
or negative 10 or negative 50 or
whatever
this would be a better representation of
a consent curve so let's take a look at
this one and discuss it in more detail
so it says the heating curve of now in
this case I said water this will not be
the heating curve of water and I wonder
if you guys can tell me why think about
it for a second so this I'm going to
change it to substance X
this would not represent the heating
curve of water let's say heating curve
of substance X or remember another way
that I can label this graph another
heading that I could use is temperature
versus time for heating of substance X
the reason why this graph would not
represent water or the heating curve of
water is because look at the melting
point so the first horizontal of the
graph is the melting point
and look at the boiling point the second
horizontal of the graph the melting
points at negative 20. the boiling point
is at 80 and we can read it off there we
know that the melting point of water is
around zero degrees Celsius not negative
20 and the boiling point is around 100
degrees Celsius not 80. so that's why I
change it to substance X but the most
important thing that I want you to
notice is my Axis so temperature versus
time as time goes on we are adding heat
energy
but let's discuss what happens in this
graph so we start off with solid phase
so I'm going to use my yellow again like
I did in the previous example to
indicate my phases so that is solid
this over here so I'm going to use this
this is solid phase
okay this over here is when my object or
when my substance is in its liquid phase
and this over here is when my substance
is in its gas phase we know that as I
add heat to substitutes it goes from
solid to liquid and liquid to gas okay
so the inclined Parts represent when my
substance is in one phase
then we've got the horizontal parts of
the graph now I need you to understand
what is actually happening in the
horizontal parts
now in the horizontal part so when I
mean horizontal I mean this product here
and this part over here
the horizontal part of the graph a phase
change is happening this is a phase
change
and what I mean by phase change is for
example we're going from a solid
to a liquid and that base change that
process is called melting
so the phase change that is happening is
solid to liquid the process is called
melting and over here we're going from a
liquid to a gas so this is another phase
change called boiling or evaporation
now why is the graph horizontal here
well what you need to notice is that
during phase changes so when a substance
is going from one phase to another solid
to liquid liquid to gas during a phase
change
there is no increase in temperature and
you might be thinking but mum housing no
increase in temperature we are adding
heat we're adding heat so what's
happening why is there no increase in
temperature well basically what happens
is as I add heat to the substance
that heats energy
is not causing the temperature to
increase we can see the temperatures
constantly at negative 20. so it's not
causing the temperature to increase but
what it is doing is it is causing the
forces between the particles they are
called
intermolecular forces
it is causing the intermolecular forces
to weaken okay it we are overcoming
those intermolecular forces
basically breaking those forces up
breaking is not a great word to use
because we don't really break a force
we've we weaken the force uh we weaken
the forces and that is causing a phase
change so think about it in order to
weaken the forces in order to cause
those particles to move further and
further apart we need energy
so all that energy that we're adding is
going into the phase change process it's
going into weakening those
intermolecular forces that's why there's
not enough energy to increase the
temperature I hope that makes sense
summarized it in the following way for
you
when we heat a substance according to
the kinetic molecular theory the kinetic
molecular theory one of two things can
happen now the first thing that can
happen is when we heat a substance so
basically we're adding heat we're adding
energy the first thing that can happen
is the temperature of the substance can
increase because of the heat absorbed
phase doesn't change in these instances
sausage are the average kinetic energy
of the particles and therefore the
temperature of the substance increases
remember average kinetic energy is a
measure of temperature I'm going to say
that again average kinetic energy is a
measure of temperature so if the average
kinetic energy increases as the
temperature increases but the substance
is still in the same phase so let us use
a color to illustrate that let's choose
yellow so the first thing that can
happen the temperature of the substance
can increase and I said yeah the
inclined parts of the graph so if we
look at another graph over here we can
see that that is this part so see
still in one face so it's still a solid
it's still a liquid yeah it's Stellar
gas there's no phase change but the
temperature is increasing
energies increasing
then the second
is I can add heat energy but the
temperature does not increase and then
you might think what happens to the heat
energy remember that heat energy is
being used to overcome the
intermolecular forces
it causes the particles to move further
and further apart that increases the
potential energy not kinetic energy so
you see I say temperature and kinetic
energy stays the same so it's the flat
parts of the graph
and during these stages so the flat
parts of the graph the temperature is
not increasing the kinetic energy is not
increasing all that energy is being used
to change phase so it's a phase change
happening
so another summary on the incline parts
of the graph that's what happens versus
on the flat parts of the graph that is
what happens and just take note that on
the flat parts of the graph when a phase
change is occurring we actually have two
phases present so this is malting this
is the the process melting is happening
over here a solid is being changed into
a liquid that's the phase change both
solid and liquid are present over here
the flat part we've got a phase change
so we're going from liquid to gas it's
called boiling or evaporation boiling
and both liquid and gas are presents
over there
so your new
be able to identify the phase or phases
present so a b will
be well BC will be a solid and a liquid
CD
remember it's an X inclined part will be
a liquid
d e will be a liquid and a gas that's
where the phase change is happening
remember both phases are presence and EF
will be a gas
and if they ask you for face changes
just remember that BC will be melting so
that's solid to liquid d e will be
boiling evaporation so that's liquid to
gas
if you want to see past paper questions
like this one please let me know in the
comments below let me know what else you
need help with and I wish you the very
best for all your preparations and all
your studies Please Subscribe share this
video give it a thumbs up if you haven't
yet
um and I hope to see you guys soon
Ver Más Videos Relacionados
5.0 / 5 (0 votes)