What is Correlational Research? Finding Relationships Between Variables
Summary
TLDRThis video explores the common misconception that correlation implies causation, using the example of a 2003 study claiming that eating pizza reduces cancer risk. It highlights the importance of understanding the difference between correlation and causation, cautioning against jumping to conclusions based on superficial links. The video discusses how other factors, like a Mediterranean diet, could be the real reason behind the observed health benefits, and explains the role of third variables in misleading correlations. It also touches on the illusory correlations found in superstitions and the statistical methods used to measure correlations.
Takeaways
- 🍕 The 2003 Italian study suggesting that eating pizza can reduce the risk of certain cancers was widely publicized but does not imply a direct causal relationship.
- 🧠 Correlation does not imply causation, a common misconception where two related variables are incorrectly assumed to have a cause-and-effect link.
- 🌿 The Mediterranean diet, rich in olive oil, fish, grains, fruits, and tomatoes, is more likely the factor contributing to cancer prevention rather than pizza alone.
- 🔍 The third variable problem cautions against assuming a direct link between two variables when an unknown third variable might be the actual cause of the observed relationship.
- 🎮 The example of violent video games and aggressive behavior illustrates the complexity of establishing causation, where other factors like family violence might be the real cause.
- 🍬 Illusory correlations, like the perceived link between eating candy and hyperactivity, are relationships that people believe exist but are not supported by evidence.
- 🏃♂️ Superstitions in sports, such as rituals performed by athletes, are often based on illusory correlations and not actual causation.
- 📊 Correlation coefficients, like Pearson's R, measure the strength and direction of a relationship between two variables, with values ranging from -1.0 to +1.0.
- ➡️ Positive correlations indicate that as one variable increases, the other also increases, while negative correlations suggest an inverse relationship.
- 📈 Scatter plots are used to graphically represent correlations, showing the direction and strength of the relationship through the pattern of data points.
Q & A
What was the claim made by Italian researchers in their 2003 scientific article about pizza?
-The Italian researchers claimed that eating pizza can reduce the risk of certain cancers.
Why did the study's findings about pizza and cancer risk receive widespread attention?
-The study's findings received widespread attention because it was a surprising and counterintuitive claim that a food often considered unhealthy, like pizza, could have health benefits such as reducing cancer risk.
What is the main caution given by other scientists and the authors of the study regarding the link between pizza and cancer risk?
-Other scientists and the authors caution against assuming a causal relationship between pizza consumption and reduced cancer risk, emphasizing that correlation does not imply causation.
What is the Mediterranean diet, and how is it related to the study on pizza and cancer risk?
-The Mediterranean diet is a diet rich in olive oil, fish, grains, fruits, and tomatoes, which is considered healthier and more likely to contribute to fighting cancer than pizza itself. The study's findings might be more related to the Mediterranean diet than to pizza directly.
What is the 'third variable problem' mentioned in the script, and how does it relate to correlations?
-The 'third variable problem' refers to a situation where two variables appear to be linked, but there is actually an unknown or third variable that is the real source of the link. This problem reminds us that correlation does not necessarily mean causation.
Can you provide an example of the 'third variable problem' from the script?
-An example given in the script is the supposed link between playing violent video games and aggressive behavior. The third variable could be exposure to family violence, which is associated with both increased risk for playing violent video games and youth violence.
What is an 'illusory correlation' as discussed in the script?
-An 'illusory correlation' is a perceived relationship between variables that does not actually exist. The script uses the example of athletes believing in superstitions, such as wearing lucky socks to improve performance, even though there is no actual correlation.
Why do psychologists conduct correlational research, and what do they aim to understand?
-Psychologists conduct correlational research to understand the relationship between two variables, specifically to see how well one variable predicts the presence or absence of another variable.
What is a correlation coefficient, and how is it used in psychology research?
-A correlation coefficient is a statistical measure that quantifies the strength and direction of a correlation between two variables. It is represented by Pearson's R, and its value can range from +1.0 to -1.0, with each extreme indicating a perfect correlation.
How are correlations typically graphed in psychological research, and what do the different elements of the graph represent?
-Correlations are typically graphed on scatter plots, where the slope indicates the direction of the correlation, and the scatter of the data points indicates the strength. Each participant or event is represented by a data point, and the closer the points are to the line of best fit, the stronger the correlation.
What is the difference between a positive and a negative correlation, and can you provide examples from the script?
-A positive correlation implies that as the value of one variable increases, the value of the other variable also increases, such as time spent on a treadmill and calories burned. A negative correlation implies that as the value of one variable increases, the value of the other variable decreases, such as alcohol consumption and judgment.
Outlines

Esta sección está disponible solo para usuarios con suscripción. Por favor, mejora tu plan para acceder a esta parte.
Mejorar ahoraMindmap

Esta sección está disponible solo para usuarios con suscripción. Por favor, mejora tu plan para acceder a esta parte.
Mejorar ahoraKeywords

Esta sección está disponible solo para usuarios con suscripción. Por favor, mejora tu plan para acceder a esta parte.
Mejorar ahoraHighlights

Esta sección está disponible solo para usuarios con suscripción. Por favor, mejora tu plan para acceder a esta parte.
Mejorar ahoraTranscripts

Esta sección está disponible solo para usuarios con suscripción. Por favor, mejora tu plan para acceder a esta parte.
Mejorar ahora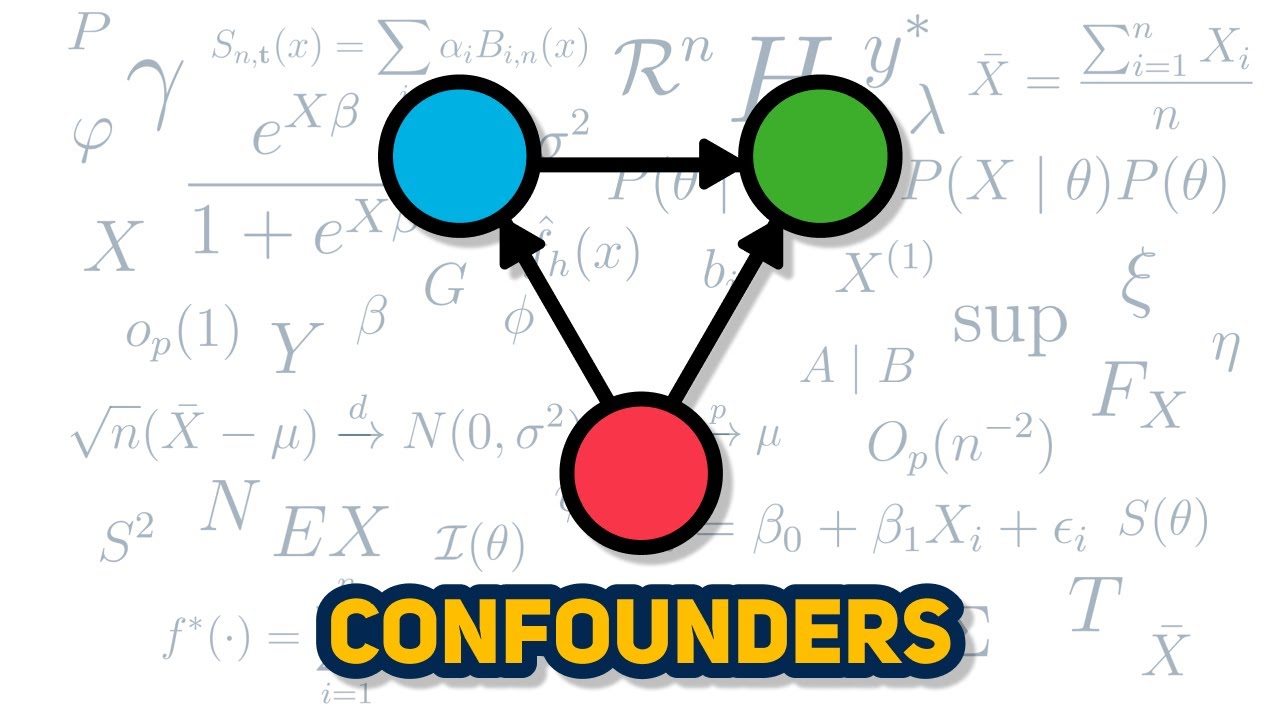


5.0 / 5 (0 votes)
