How To Graph Trigonometric Functions | Trigonometry
Summary
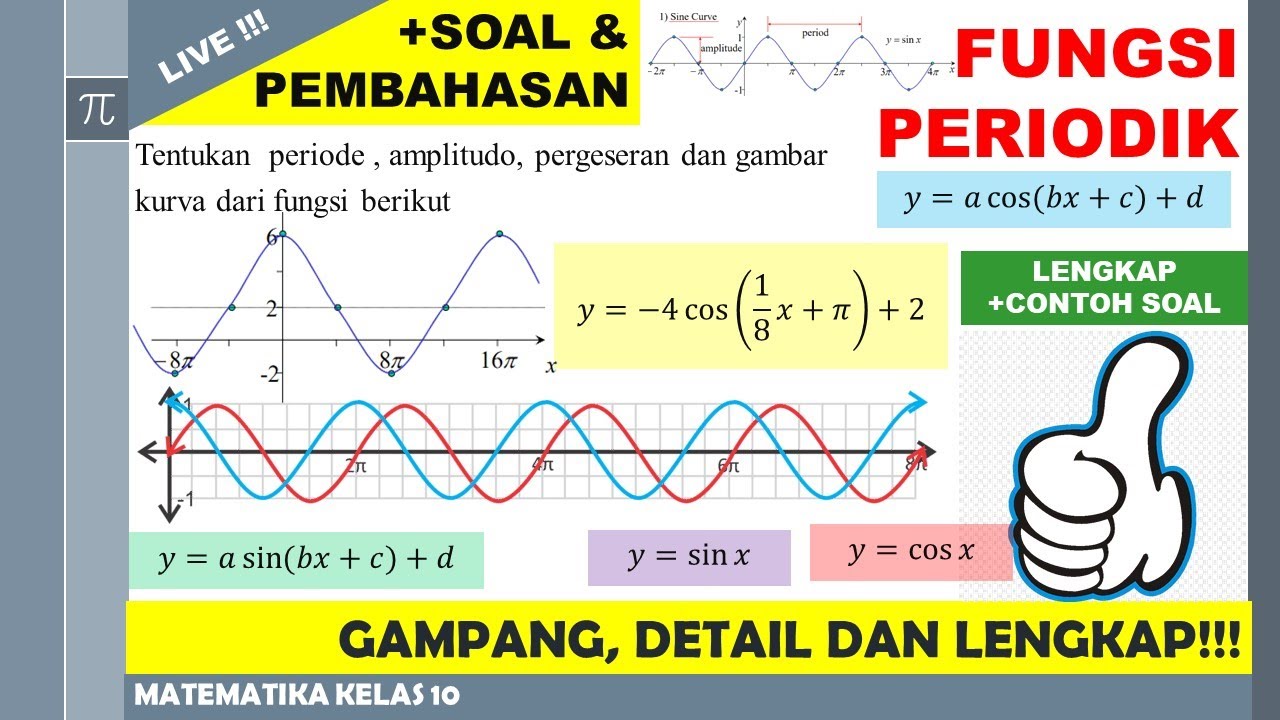
TLDRThis educational video script delves into the intricacies of graphing trigonometric functions, focusing on the sine and cosine functions. It explains how the amplitude affects the vertical stretch or compression of the graph, and how the period is calculated using the formula 2π divided by the coefficient of x. The script also covers phase shifts, detailing how to determine them and their impact on the graph's starting point. Practical examples, such as graphing 'y = 2 sin(x)' and 'y = -3 cos(x)', are provided to illustrate these concepts, making the complex nature of trigonometric graphing more accessible.
Takeaways
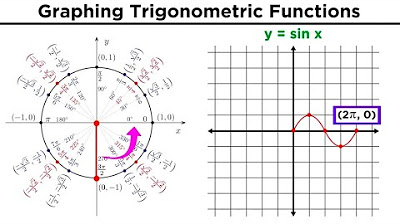
- 🌊 The sine function, \( \sin x \), graphs as a sinusoidal wave with one period ending at \( 2\pi \).
- 🔄 Adding a negative sign in front of the sine function flips the wave over the x-axis, inverting its direction.
- 📈 The cosine function, \( \cos x \), starts at the top for one period, unlike sine which starts at the center.
- 🔄 Negative cosine function graphs start at the bottom and follow a similar pattern to negative sine but inverted vertically.
- 📊 Graphing multiple cycles involves breaking each cycle into four key points to plot the wave accurately.
- 🔝 The amplitude of a sine wave is determined by the coefficient 'a' in front of the sine function, indicating the wave's peak height from the midline.
- 🔄 Doubling the amplitude, as in \( 2\sin x \), stretches the graph vertically, with the wave varying from -2 to 2.
- 🔢 The amplitude of a cosine function is the absolute value of the coefficient in front of cosine, as in \( -3\cos x \) where the amplitude is 3.
- ⏱ The period of a sine or cosine function is found by dividing \( 2\pi \) by the coefficient 'b' in front of 'x', affecting the wave's horizontal stretch.
- 🔄 A vertical shift in the graph is indicated by a constant added to the function, such as in \( \sin x + 3 \), which raises the entire wave by 3 units.
- 🔄 Phase shifts in trigonometric functions are calculated by setting the inside of the function to zero and solving for 'x', determining where the wave starts on the x-axis.
Q & A
What is the basic shape of the sine function, sine x?
-The sine function, sine x, is a sinusoidal function that forms a sine wave. It oscillates between -1 and 1, starting at the origin, going up to 1, back down to -1, and then back to the origin, completing one full cycle at 2π.
How does the graph of sine x change if a negative sign is placed in front of it?
-Placing a negative sign in front of the sine function, as in -sine x, flips the graph over the x-axis. Instead of starting at the origin and going up, it starts at the origin and goes down, creating a wave that oscillates between -1 and 1 in the opposite direction.
What is the starting point of the cosine function, cosine x, on the graph?
-The cosine function, cosine x, starts at the top of its cycle, which is the value 1 on the y-axis, as opposed to the sine function that starts at the center (origin).
How does the graph of cosine x differ when a negative sign is included, as in -cosine x?
-For -cosine x, the graph starts at the bottom of the wave, going up to the middle, then to the top, back to the middle, and then back down, completing one cycle.
What are the four useful points to consider when graphing one cycle of the sine wave?
-The four useful points to consider when graphing one cycle of the sine wave are π/2, π, 3π/2, and 2π. These points help in breaking up the cycle into four intervals for easier graphing.
What is the amplitude of the sine wave and how is it represented in the function's formula?
-The amplitude of the sine wave is the distance from the midline of the wave to its peak (or trough). It is represented by the coefficient 'a' in the function's formula, as in a sin(bx + c) + d, where 'a' is the amplitude.
How does the amplitude affect the graph of the sine function when it is doubled, as in 2 sine x?
-Doubling the amplitude, as in 2 sine x, causes the graph to stretch vertically. The wave will now oscillate between -2 and 2 instead of the usual -1 and 1 range.
What is the domain and range of the cosine graph for the function y = -3 cosine x?
-The domain of the cosine graph for y = -3 cosine x is all real numbers, as it is for all sine and cosine functions. The range is from the lowest y-value, which is -3, to the highest y-value, which is 3.
How does the period of the sine function change with the value of 'b' in the function a sin(bx)?
-The period of the sine function is determined by the value of 'b' and is calculated as 2π/b. If 'b' is increased, the period decreases, causing the graph to complete more cycles in the same horizontal distance.
What is a phase shift in trigonometric functions and how do you calculate it?
-A phase shift is a horizontal shift to the left or right of the graph of a trigonometric function. It is calculated by setting the inside of the function equal to zero and solving for 'x', which gives the phase shift value. For example, in the function a sin(bx + c), the phase shift is -c/b.
Outlines

Esta sección está disponible solo para usuarios con suscripción. Por favor, mejora tu plan para acceder a esta parte.
Mejorar ahoraMindmap

Esta sección está disponible solo para usuarios con suscripción. Por favor, mejora tu plan para acceder a esta parte.
Mejorar ahoraKeywords

Esta sección está disponible solo para usuarios con suscripción. Por favor, mejora tu plan para acceder a esta parte.
Mejorar ahoraHighlights

Esta sección está disponible solo para usuarios con suscripción. Por favor, mejora tu plan para acceder a esta parte.
Mejorar ahoraTranscripts

Esta sección está disponible solo para usuarios con suscripción. Por favor, mejora tu plan para acceder a esta parte.
Mejorar ahoraVer Más Videos Relacionados

Fungsi 12: Fungsi Periodik dan Grafik Fungsi Trigonometri Kelas 10

Fungsi Trigonometri (Part 1) Grafik Fungsi Sinus

Graphing Trigonometric Functions

Basic trigonometry II | Basic trigonometry | Trigonometry | Khan Academy

Proving Trigonometric Identities (Tagalog/Flipino Math)

Integral Trigonometri Dasar, Substitusi & Menggunakan Identitas Trigonometri (Integral Part 6)
5.0 / 5 (0 votes)
