Storing & Tracking Your Life Using GIS Technology | Cheryl Hanewicz | TEDxUVU

TEDx Talks
7 Jul 201511:30

Summary

TLDRThis script delves into Geographic Information Systems (GIS), showcasing its vast applications in various fields. From predicting election outcomes and crime patterns to public health and real estate, GIS technology offers deep insights into spatial data. However, it raises concerns about privacy and the potential for misuse, such as gerrymandering and tracking individual behaviors. The speaker urges caution, emphasizing the importance of protecting personal data and ensuring technology serves to enhance, not homogenize, society.

Takeaways

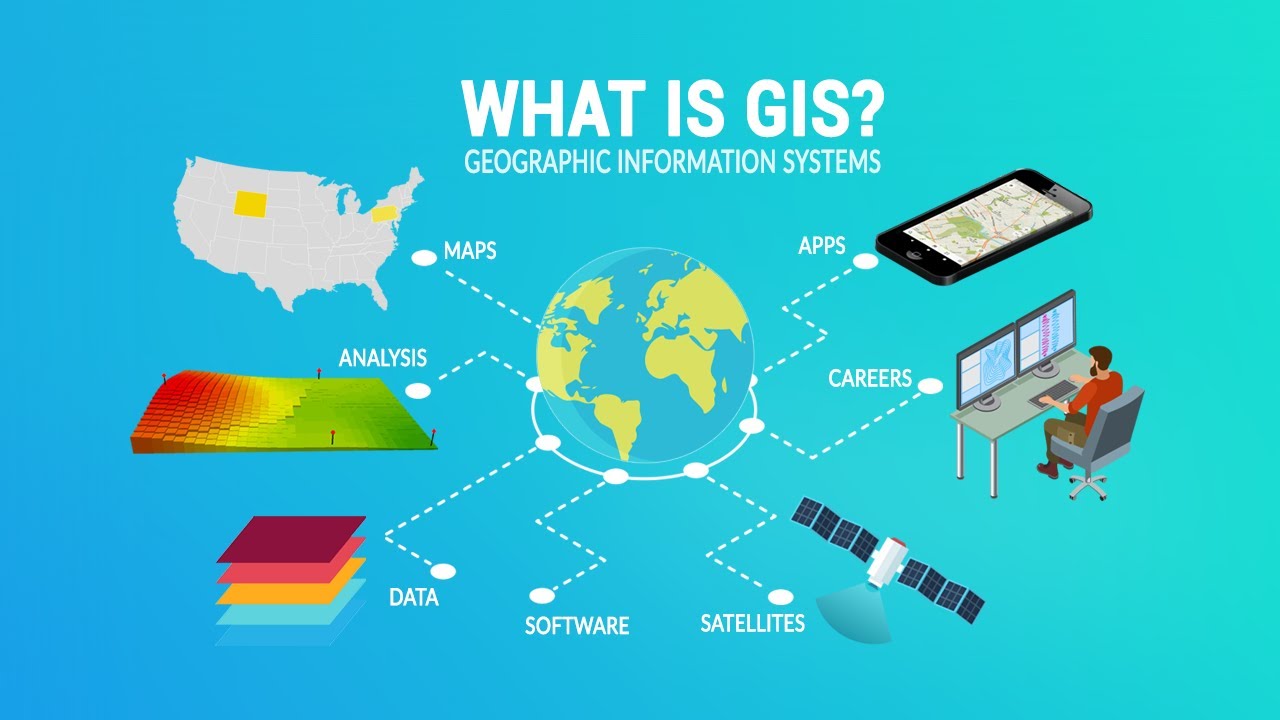
  • 🗺️ GIS, or Geographic Information Systems, is a technology that uses large databases to capture, store, and analyze spatial information, allowing for inferences about individuals and communities based on lifestyle patterns.
  • 🏢 Large organizations like the United States Census Bureau use GIS to create visual maps, such as the population density map of Utah, to understand demographic distributions.
  • 🚶‍♂️ Population patterns are often visible along significant infrastructures like highways, as seen with the majority of Utah's citizens living along the I-15 corridor.
  • 📊 GIS provides a visual and effective way to communicate aggregated data, as opposed to raw data in spreadsheets, making patterns and trends more accessible.
  • 🏛 Politicians and political campaigns leverage GIS for strategy development, targeting specific areas, and understanding voter concentrations, as demonstrated in Maricopa County, Arizona.
  • 🔍 The cautionary note about GIS data representing a limited view is highlighted, as maps may not fully represent the ground realities, such as the presence of non-residential areas within voter clusters.
  • 👮‍♂️ Law enforcement uses GIS for crime analysis, resource allocation, and patrol planning, by visualizing crime incidences and types on maps.
  • 🏥 The CDC utilizes GIS to track and analyze the spread of diseases over time, such as flu activity, allowing for trend identification and response planning.
  • 🏘️ Real estate industry benefits from GIS by allowing potential buyers to select neighborhoods based on various characteristics, including occupational clusters, income trends, and demographic details.
  • 🔑 Privacy concerns arise with the use of GIS, as it can lead to the tracking and analysis of individual behaviors, potentially threatening personal freedoms and diversity.
  • 🛡️ The script emphasizes the importance of protecting personal data and being cautious about the use of technology, advocating for technology to be a beneficial tool rather than a risk to individuality and privacy.

Q & A

  • What is a GIS and how can it be used to make inferences about individuals?

    -A GIS, or Geographic Information System, is a large database that captures, stores, and analyzes spatial information. It can be used to make inferences about individuals by analyzing patterns in their lifestyle, as well as those of their neighbors and friends, based on spatial data.

  • How does the United States Census Bureau utilize GIS technology?

    -The United States Census Bureau uses GIS technology to create maps, like the one of Utah, which show population densities and demographic information based on census data. This helps in understanding where most citizens live and how populations are distributed across different regions.

  • What can be inferred from the population map of Utah created with 2010 census data?

    -The population map of Utah reveals that most citizens live along the I-15 highway corridor, which runs north and south through the state. The capital, Salt Lake City, is located in the north, slightly above the red dot indicating the population mean of the state.

  • How are GIS maps used in the political landscape?

    -GIS maps are used in the political landscape to develop campaign strategies, target hot spots, and learn more about constituencies. They can show voting patterns and concentrations of voters, which can inform political strategies and outreach efforts.

  • What is the difference between viewing data in an Excel spreadsheet and viewing it on a GIS map?

    -While an Excel spreadsheet presents data in rows and columns, a GIS map visually represents the same data in a spatial context. Maps are a more effective vehicle for communicating patterns of aggregated data, making it easier to understand and analyze spatial relationships and distributions.

  • Why might a 'get out the vote' campaign be cautious about targeting areas with low voter registration shown on a GIS map?

    -A campaign should be cautious because GIS maps provide a limited view of information and do not show the whole picture. Low voter registration areas might be places like airports or golf courses where there are no potential voters to engage.

  • How can legislators use GIS maps for town hall meetings on specific issues?

    -Legislators can use GIS maps to target specific demographic groups, such as senior citizens for a town hall on social security issues. By pulling in data on age distribution, they can easily identify areas with higher concentrations of the target demographic.

  • What concerns arise with the ability of GIS technology to look into neighborhoods and predict behavior?

    -The concerns include the potential for state-of-the-art gerrymandering, where districts are redrawn to benefit a political party or person, and the risk to individual privacy and freedom of choice as behavior prediction becomes more accurate.

  • How does law enforcement use GIS technology in crime prevention and resource allocation?

    -Law enforcement uses GIS technology to create crime maps that show where most crime incidences have taken place. This helps in allocating resources, such as the number of police officers on a particular shift and where and when they should patrol.

  • What is the significance of being able to overlay different types of data on a GIS map?

    -Overlaying different types of data on a GIS map allows for a more comprehensive analysis. For example, combining crime data with information about housing, businesses, income levels, and education patterns can provide insights into the lifestyles and patterns of criminals, aiding in more effective crime prevention strategies.

  • How can the real estate industry use GIS technology to enhance the home-buying process?

    -The real estate industry uses GIS technology to allow potential buyers to select desired neighborhood characteristics before even looking for a house. This can include factors like school quality, crime patterns, occupational clusters, income trends, ethnicities, and even languages spoken in the home.

  • What ethical considerations should be taken into account when using GIS technology?

    -Ethical considerations include protecting individual privacy, being cautious about who has access to personal data, and ensuring that technology remains a tool that benefits lives rather than compromising individuality and uniqueness. It's important to remember that behind every data point is a real person whose privacy and individuality should be respected.

Outlines

00:00

🗺️ Geographic Information Systems (GIS) Overview

This paragraph introduces Geographic Information Systems (GIS) as a technology that captures, stores, and analyzes spatial information. It highlights how GIS can be used to infer lifestyle patterns of individuals and communities, with the United States Census Bureau as a notable user. The script uses a map of Utah created from 2010 census data to illustrate population density and distribution, emphasizing the visual advantages of GIS over traditional data presentation methods like Excel spreadsheets. It also touches on the political applications of GIS in campaign strategies and constituency understanding, using Maricopa County, Arizona as an example.

05:01

🛡️ Privacy and Precision in GIS Applications

The second paragraph delves into the implications of GIS technology on privacy and the precision of predicting electoral outcomes. It discusses the potential for gerrymandering and the use of GIS by law enforcement to allocate resources and predict crime patterns, using a crime map of Salt Lake City as an example. The script also explores the integration of various data types, such as demographic and economic information, to enhance the effectiveness of GIS in research. The CDC's use of GIS to track flu activity over time is highlighted, showing the ability of GIS to analyze trends and compare data across different periods.

10:02

🏘️ Real Estate and Social Implications of GIS

The final paragraph examines the impact of GIS on the real estate industry and the broader social implications of data tracking. It discusses how individuals can select neighborhood characteristics before house hunting, including factors like school quality, crime patterns, and demographic trends. The paragraph raises questions about privacy and the potential for individuals to self-select into homogeneous communities, thus losing diversity. It concludes with a call for companies and governments to respect and protect personal data, emphasizing the importance of technology serving to benefit individual lives without compromising uniqueness and individuality.

Mindmap

Keywords

💡GIS (Geographic Information Systems)

GIS is a technology that uses a large database to capture, store, and analyze spatial information. It is central to the video's theme, illustrating how spatial data can be used to make inferences about individuals and communities. For example, the script mentions a GIS map of Utah created with census data, showing population densities and patterns.

💡Spatial Information

Spatial information refers to data that is linked to a specific location. It is a key component of GIS, allowing for the analysis of patterns and trends in geographic areas. The video script uses this concept to explain how lifestyle patterns can be inferred from spatial data.

💡Census Bureau

The Census Bureau is an entity that collects and provides demographic data through censuses. In the video, it is mentioned as a large user of GIS, using it to create maps like the one of Utah with 2010 census population data.

💡Population Density

Population density is the number of people living in a given area. The video script uses this concept to describe how GIS can visually represent where people are concentrated, as seen in the Utah map with dark blue color indicating high density areas.

💡I-15 Highway Corridor

The I-15 Highway Corridor mentioned in the script is a geographical reference point that shows where most citizens live in Utah, running north and south through the state. It exemplifies how GIS can highlight patterns of human settlement.

💡Political Landscape

The term 'political landscape' in the video refers to the use of GIS in politics, such as for campaign strategies and understanding constituencies. The script discusses how politicians use GIS to target voting districts and develop campaign strategies.

💡Gerrymandering

Gerrymandering is the practice of manipulating electoral district boundaries to favor a particular group or party. The video raises concerns about the potential misuse of GIS for sophisticated gerrymandering, impacting the freedom of choice in elections.

💡Law Enforcement

Law enforcement is mentioned in the context of using GIS for crime mapping and resource allocation. The script describes how police officials can use GIS to identify crime patterns and allocate resources effectively.

💡Crime Map

A crime map is a visual representation of crime data, showing where incidents have occurred. The video script uses the example of a crime map of Salt Lake City to illustrate how GIS can help in understanding and addressing crime patterns.

💡CDC (Centers for Disease Control and Prevention)

The CDC is a public health institute that uses GIS for tracking and analyzing disease patterns. The script refers to a CDC map showing flu activity, demonstrating how GIS can be used for public health monitoring and trend analysis.

💡Real Estate Industry

The real estate industry is highlighted in the script as a sector that utilizes GIS to analyze neighborhood characteristics and preferences. It discusses how GIS enables购房者 to select desired neighborhood traits before house hunting, impacting how communities are formed.

💡Privacy

Privacy is a recurring concern in the video, discussing how the use of GIS and the collection of personal data can infringe on individual privacy. The script emphasizes the importance of protecting personal data and being cautious about the information we share and how it is used.

Highlights

GIS technology can predict voting patterns and health trends based on spatial data analysis.

The United States Census Bureau uses GIS to map population densities and develop demographic insights.

GIS maps can visually represent data, making it easier to understand patterns like population clusters along transportation routes.

Politicians use GIS for campaign strategies, targeting voter hotspots, and understanding constituencies.

GIS can be used to analyze and predict electoral outcomes with increasing precision, raising questions about the impact on voter freedom.

Law enforcement utilizes GIS for crime mapping to allocate resources and patrol strategies effectively.

Combining GIS with other data sources, such as income or education levels, can reveal correlations and inform policy decisions.

The CDC uses GIS to track and analyze the spread of diseases like the flu over time and across regions.

GIS technology allows real estate industry to offer sophisticated neighborhood characteristic selections for buyers.

The potential for privacy invasion and the ethical use of personal data collected through GIS is a significant concern.

Individuals should be cautious about the information they give away and how it is used by companies and governments.

GIS technology can lead to gerrymandering if used unethically to manipulate electoral districts for political advantage.

The real estate industry uses GIS to analyze and predict income trends and demographic changes in neighborhoods.

GIS can help in understanding crime patterns and allocating police resources more effectively.

The ability to overlay different types of data on GIS maps enhances the analysis of complex social and health issues.

GIS technology must be used responsibly to ensure it benefits society without compromising individual privacy and freedom.

The speaker emphasizes the importance of maintaining individuality and preventing a homogeneous society due to unchecked GIS use.

Transcripts

play00:05

you've already voted in the next

play00:08

election and don't even know it

play00:11

imagine being able to determine your

play00:14

likelihood of getting sick with the

play00:16

click of a mouse

play00:17

these scenarios are possible using a

play00:21

technology called a GIS or geographic

play00:23

information systems a GIS is a large

play00:28

database that can capture store and

play00:31

analyze spatial information using it we

play00:37

can make a lot of inferences about you

play00:39

based on the patterns of your lifestyle

play00:41

the patterns of your neighbors lifestyle

play00:43

and the patterns of your friends

play00:45

lifestyle it's very interesting and a

play00:50

lot of people use it who one large user

play00:54

is the United States Census Bureau this

play00:58

is a map of the state of Utah and it was

play01:01

created with 2010 census population data

play01:05

you can clearly see where the densities

play01:07

of population are located by the dark

play01:10

blue color the capital Salt Lake City is

play01:15

located in the North slightly above that

play01:18

red dot that's just the population mean

play01:21

of the state now most citizens live

play01:24

along the i-15 highway corridor which

play01:27

runs north and south through the state

play01:29

now although it's not pictured on this I

play01:33

bet you could draw it in quite

play01:35

accurately by following the patterns you

play01:38

see of the population clusters maps are

play01:42

a great way to view things visually GIS

play01:47

is also an established part of the

play01:49

political landscape politicians have

play01:52

found innovative ways to use it to

play01:55

develop new campaign strategies target

play01:58

hot spots or even learn more about their

play02:01

constituencies this is a map of Maricopa

play02:06

County and it's in Arizona in its 2012

play02:10

census data and you're looking at a

play02:13

region here of the greater Phoenix area

play02:15

now there are a couple map

play02:18

layers that are selected one is the

play02:21

congressional districts and you can see

play02:23

the outline there in blue the other one

play02:26

is voting districts by registered voters

play02:30

and there's different shading to

play02:33

indicate you know different

play02:35

concentrations of voters the toward the

play02:38

top there if you look at the red that's

play02:41

forty five hundred or greater the blue

play02:44

you can see the patterns there those are

play02:47

fewer than a thousand let's look at this

play02:53

a different way for a minute I'm sure

play02:54

you're all familiar with an Excel

play02:57

spreadsheet rows and rows and columns of

play03:01

data you're looking at it visually here

play03:04

behind this map are rows in rows of data

play03:07

some of its spatial like latitude and

play03:10

longitude in order for the software to

play03:13

draw the map now if you are trying to

play03:16

determine how many registered voters

play03:18

were in each congressional district in

play03:20

the patterns of distribution would you

play03:23

rather I handed you that excel

play03:24

spreadsheet or the map this is a much

play03:29

better vehicle for communicating

play03:32

patterns of aggregated data how else

play03:37

could you use this well if you are going

play03:40

to be in charge of the next get out the

play03:41

vote campaign where would you like lis

play03:43

send your workers you might be tempted

play03:47

to run to those low places there in the

play03:49

blue but we need to be cautious about

play03:52

what maps really tell us it's only a

play03:55

limited view of information it's not the

play03:58

whole picture so you might run out to

play04:00

the blue spots and find yourself

play04:02

standing in the middle of an airport or

play04:04

a golf course or some other region that

play04:08

there's really you don't have anybody to

play04:10

sign up so we need to be cautious the

play04:15

legislators can also use maps together

play04:18

for example if a legislator was looking

play04:21

to have a town hall on social security

play04:24

issues he or she might want to target

play04:27

the senior citizens and could pull in

play04:30

data on

play04:31

SMAP here that shows age distribution so

play04:34

it becomes very easy to see now this

play04:38

ability for government officials to look

play04:41

right down into your neighborhood this

play04:44

we need to be cautious here because it

play04:46

sets up for us to be able to use GIS for

play04:50

state of the art gerrymandering now

play04:53

gerrymandering is the intentional

play04:55

redrawing of a district for to benefit a

play05:00

political party or a person oftentimes

play05:03

to get more voters now according to

play05:07

Benjamin Forrest sophisticated analytic

play05:11

techniques and GIS technology allow us

play05:15

to understand and predict electoral

play05:18

outcomes and effects with increasing

play05:21

precision think about that if we are

play05:26

able to more accurately predict election

play05:30

results in consequences what does your

play05:34

freedom of choice really mean well

play05:42

there's another profession that likes

play05:44

this ability to try to predict behavior

play05:47

law enforcement this is a crime map of

play05:52

an area in Salt Lake City Utah and you

play05:55

can easily see by looking at it were

play05:57

where most of the crime incidences have

play05:59

taken place in the south area here you

play06:03

can even see what kinds of crimes they

play06:05

are by the little icon now police

play06:09

officials can use this to help allocate

play06:11

resources such as how many police

play06:14

officers should be on a particular shift

play06:16

where they should patrol maybe even what

play06:19

time they should patrol now it gets

play06:24

really exciting again when we can start

play06:26

adding other information to this to this

play06:28

map right here what if we pulled in

play06:30

houses or where businesses are located

play06:32

to find out maybe if this is is it

play06:35

residential crime or we can start

play06:40

pulling in in income information from

play06:44

the Census Bureau the

play06:45

patterns of Education levels what might

play06:48

start happening as we march might start

play06:50

learning something very interesting

play06:51

about the lifestyles of the criminals

play06:54

themselves it's this ability to mix

play06:58

different kinds of data and portray it

play07:00

on a map that makes it so effective for

play07:03

researchers this this map here is from

play07:09

the CDC the Centers for Disease Control

play07:11

and Prevention and it shows widespread

play07:14

flu activity ending January 10th 2015

play07:18

now by the dark brown color you can see

play07:21

there's lots of widespread flu activity

play07:24

maps are also effective because we can

play07:26

start analyzing trends over time so we

play07:29

can compare it let's look a month ahead

play07:32

now we're into February you can start

play07:36

seeing that in the Midwest of the United

play07:38

States we're starting to see more

play07:40

localized flu activity but it's still on

play07:44

the west coast and the East Coast let's

play07:48

try one more

play07:49

March now we notice there's very little

play07:53

widespread flu activity but where do you

play07:56

notice it in the Northeast

play07:58

now given the harsh winter that we've

play08:00

had I would imagine if we were to get

play08:03

some weather maps and overlay them and

play08:05

maybe start looking at them over time it

play08:08

might help us determine why we still

play08:10

have widespread activity in the

play08:13

Northeast

play08:13

now many professions use spatial

play08:16

technology but I just want to cover one

play08:18

more the real estate industry buying has

play08:22

become so sophisticated that you can

play08:25

select desired neighborhood

play08:27

characteristics before you even start

play08:29

looking for your house these these are

play08:32

traditional ones you know quality of

play08:35

schools crime patterns but now you can

play08:40

dig deeper and make more selections you

play08:43

can include items like clusters of

play08:46

occupations income trends are they going

play08:49

up are they going down ethnicities even

play08:53

languages spoken in the home but will

play08:57

people choose to live

play08:59

of in diverse communities or will they

play09:02

start to self-select and want to live

play09:05

with neighbors who look and act a lot

play09:07

like them at what point is your privacy

play09:14

in jeopardy how much freedom are you

play09:22

willing to give up to continue to use

play09:25

the technologies that are able to track

play09:31

you know these are very important

play09:33

questions part of the reason why they

play09:35

have all this is you give away

play09:37

information about yourself every day

play09:38

every time you buy something and swipe a

play09:41

credit card or sink your technologies

play09:45

you're giving it away now if only the

play09:49

companies that were using it were the

play09:50

ones that were maintaining it this

play09:52

wouldn't be a problem but the ease with

play09:54

which vast computer networks can talk to

play09:57

each other companies are buying and

play09:59

selling your information every single

play10:01

day and combining it with everybody

play10:03

else's trying to find social patterns

play10:06

and we can get historical information

play10:08

and start to look at social patterns

play10:11

over time how do we assure that we

play10:17

maintain the power of our vote or our

play10:22

individuality to the growing impact of

play10:25

GIS technology well companies in

play10:31

government's need to remember that

play10:33

behind every fact and figure is a real

play10:36

person in individuals everybody here you

play10:41

need to protect your personal data you

play10:43

need to value your personal data be

play10:45

stingy about who gets it and

play10:53

find out what everybody's doing with it

play10:58

we need to remember that technology must

play11:01

remain a tool that benefits our you know

play11:03

benefits our lives because G is

play11:06

technology unchecked puts us at risk of

play11:10

becoming a homogeneous society in which

play11:15

the individuality and uniqueness that we

play11:18

value are no longer important thank you

Rate This

5.0 / 5 (0 votes)

Etiquetas Relacionadas
GIS TechnologyData PrivacySpatial AnalysisCensus DataPolitical StrategyCrime MappingHealth TrendsReal EstateBehavior PredictionElection Outcomes
¿Necesitas un resumen en inglés?