t-tests mini lecture
Summary
TLDRThis lesson explains the concept and application of the t-test, a statistical method used when the population variance is unknown and must be estimated from the sample. It clarifies the process of adjusting sample variance to estimate the population variance using degrees of freedom (n-1), and the use of the t-distribution for hypothesis testing. The video also discusses the comparison of sample means to a population mean, the importance of selecting the correct t-distribution based on degrees of freedom, and the robustness of the t-test under normality assumptions. The summary concludes with the steps for calculating the t-score and making decisions about the null hypothesis.
Takeaways
- 📚 In real-world scenarios, we often lack population characteristics like mean, variance, and standard deviation, and instead rely on sample data to estimate these values.
- 🧐 The sample variance is typically lower than the population variance, which can lead to estimation errors if not properly adjusted.
- 🔍 To estimate the population variance, we use a modified formula that divides the sum of squares by the degrees of freedom (n - 1), where n is the sample size.
- 📉 The degrees of freedom represent the number of independent values in the sample that can vary before the last value can be determined.
- 📊 When comparing sample means to a population, we use the T-distribution if the population variance is unknown, as it accounts for the increased variability in sample estimates.
- 📈 The T-distribution is flatter and has more extreme values compared to the normal distribution, with different distributions corresponding to different degrees of freedom.
- 📝 The comparison distribution's cutoff scores are determined by the degrees of freedom and the type of hypothesis (one-tailed or two-tailed), with tables provided for reference.
- 🔢 The variance of the distribution of means is calculated by dividing the estimated population variance by the sample size (n).
- 📐 The standard deviation of the distribution of means, or the standard error, is found by taking the square root of the variance of the distribution of means.
- 🔄 There are two different divisions in the process: one to estimate the population variance (using n - 1) and another to find the variance of the distribution of means (using n).
- 📉 T-tests are used for single samples to compare against a population mean, and also for dependent means, such as pre- and post-test scores, assuming a normal population distribution.
Q & A
What is the primary difference between the real world and the examples used in calculations regarding population characteristics?
-In the real world, we often do not have information about population characteristics like the mean, variance, and standard deviation. We must estimate these values from our sample data, unlike in examples where these values are usually given.
Why is it important to make adjustments when estimating the population variance from a sample?
-The sample variance is typically smaller than the population variance, which can lead to errors if not adjusted. Adjustments help to more accurately estimate the population variance and reduce the potential for error.
What is the purpose of dividing the sums of squares by 'n minus one' when calculating the estimated population variance?
-'N minus one,' also known as degrees of freedom, is used to account for the fact that the sample variance is usually smaller than the population variance. It provides a more accurate estimate by considering the number of scores that can vary before the last one is determined.
How does the T distribution differ from the normal distribution, and when is it used?
-The T distribution is flatter and has more scores in the extremes compared to the normal distribution. It is used when the population variance is unknown, and we need to estimate it from the sample.
What does the degrees of freedom represent in the context of T distribution?
-Degrees of freedom refer to the number of scores in a sample that are free to vary before the final score is determined. It is calculated as 'n minus one,' where 'n' is the sample size.
Why is it important to choose the appropriate T distribution based on the degrees of freedom?
-Each T distribution corresponds to a specific degrees of freedom, which affects the shape of the distribution. Choosing the correct one ensures accurate calculations, especially for critical values in hypothesis testing.
What role does the T distribution play when conducting a T test with a sample?
-The T distribution is used as the comparison distribution when conducting a T test. It allows us to compare the sample mean to the population mean, especially when the population variance is unknown.
What is the process for calculating the standard deviation of the distribution of means in a T test?
-First, estimate the population variance by dividing the sums of squares by the degrees of freedom. Then, calculate the variance of the distribution of means by dividing the estimated population variance by the full sample size. The standard deviation of the distribution of means is the square root of this variance.
What is a common application of the T test for dependent means?
-A common application is in pre-post testing scenarios, where a sample is tested before and after an intervention, and the means are compared to determine if there is a significant difference.
How robust is the T test with regard to violations of the normality assumption?
-The T test is very robust and can tolerate violations of the normality assumption to a significant extent. It still produces reliable results even when the population distribution is not perfectly normal.
Outlines

Dieser Bereich ist nur für Premium-Benutzer verfügbar. Bitte führen Sie ein Upgrade durch, um auf diesen Abschnitt zuzugreifen.
Upgrade durchführenMindmap

Dieser Bereich ist nur für Premium-Benutzer verfügbar. Bitte führen Sie ein Upgrade durch, um auf diesen Abschnitt zuzugreifen.
Upgrade durchführenKeywords

Dieser Bereich ist nur für Premium-Benutzer verfügbar. Bitte führen Sie ein Upgrade durch, um auf diesen Abschnitt zuzugreifen.
Upgrade durchführenHighlights

Dieser Bereich ist nur für Premium-Benutzer verfügbar. Bitte führen Sie ein Upgrade durch, um auf diesen Abschnitt zuzugreifen.
Upgrade durchführenTranscripts

Dieser Bereich ist nur für Premium-Benutzer verfügbar. Bitte führen Sie ein Upgrade durch, um auf diesen Abschnitt zuzugreifen.
Upgrade durchführenWeitere ähnliche Videos ansehen
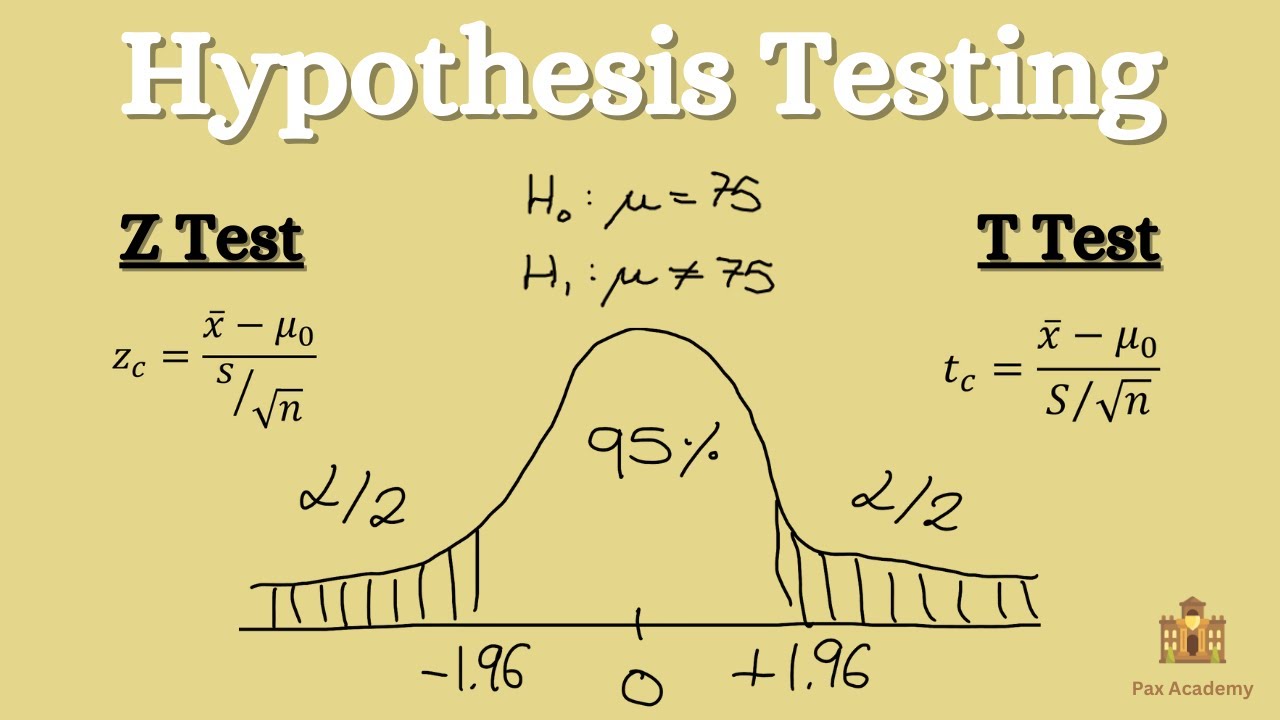
Hypothesis Testing - Z test & T test

Inferência Aula 32 - Teste de Hipótese para Média com Variância Desconhecida
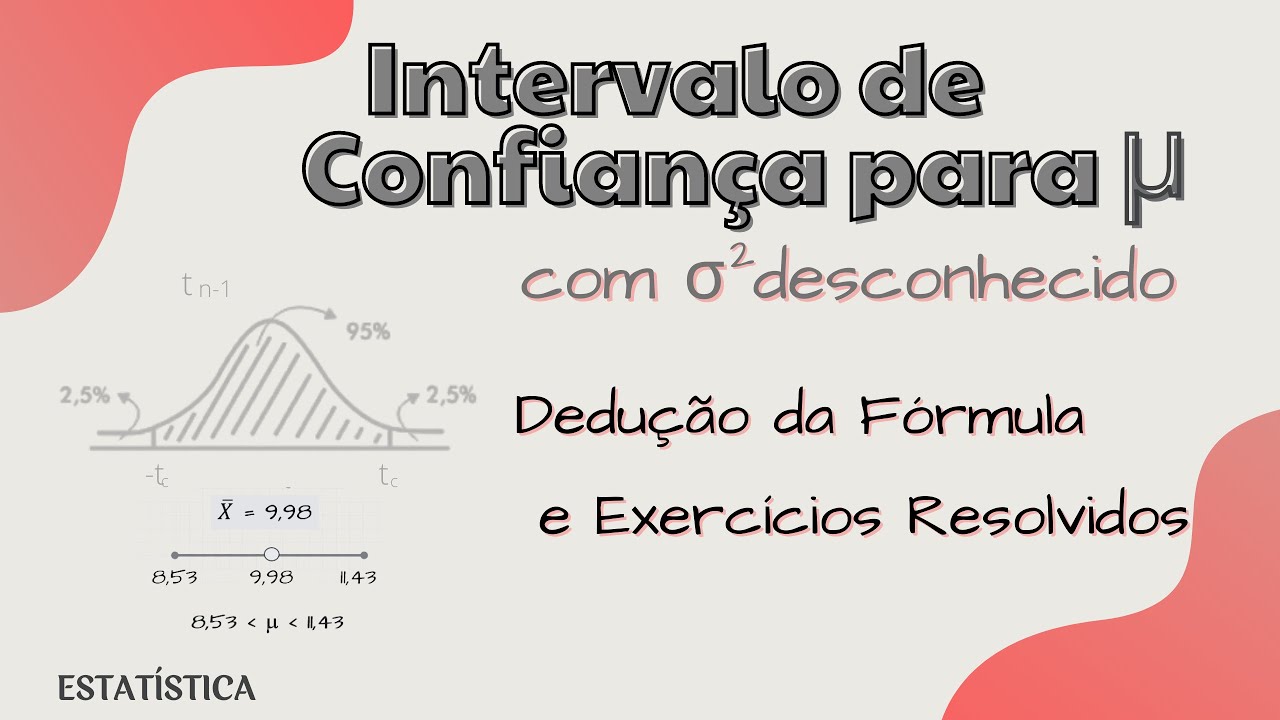
Intervalo de Confiança para a MÉDIA (μ) com variância populacional desconhecida

Pemilihan statistik Z atau t
Independent Sample T- Test
Confidence Interval Concept Explained | Statistics Tutorial #7 | MarinStatsLectures
5.0 / 5 (0 votes)
