Inferência Aula 32 - Teste de Hipótese para Média com Variância Desconhecida
Summary
TLDRIn this lesson, Professor Douglas explains hypothesis testing for population means when the population variance is unknown. He covers key concepts like the steps of hypothesis testing, using the Student's t-distribution, and calculating the test statistic. The lesson includes an example involving a school's average student score and a sample from a new class. The professor also details how to determine whether to reject or accept the null hypothesis, based on the calculated test statistic and critical value. The lesson emphasizes the importance of understanding statistical distributions and proper testing methods.
Takeaways
- 😀 The lesson focuses on hypothesis testing for a population mean with unknown variance, using the Student's t-distribution.
- 😀 In the previous lesson, hypothesis testing with known population variance was discussed, and it’s recommended to review it for understanding the basics.
- 😀 The Student’s t-distribution is used when the sample size is small (n < 30) or when the population variance is unknown.
- 😀 For larger sample sizes (n > 30), the normal distribution can be used as an approximation for hypothesis testing.
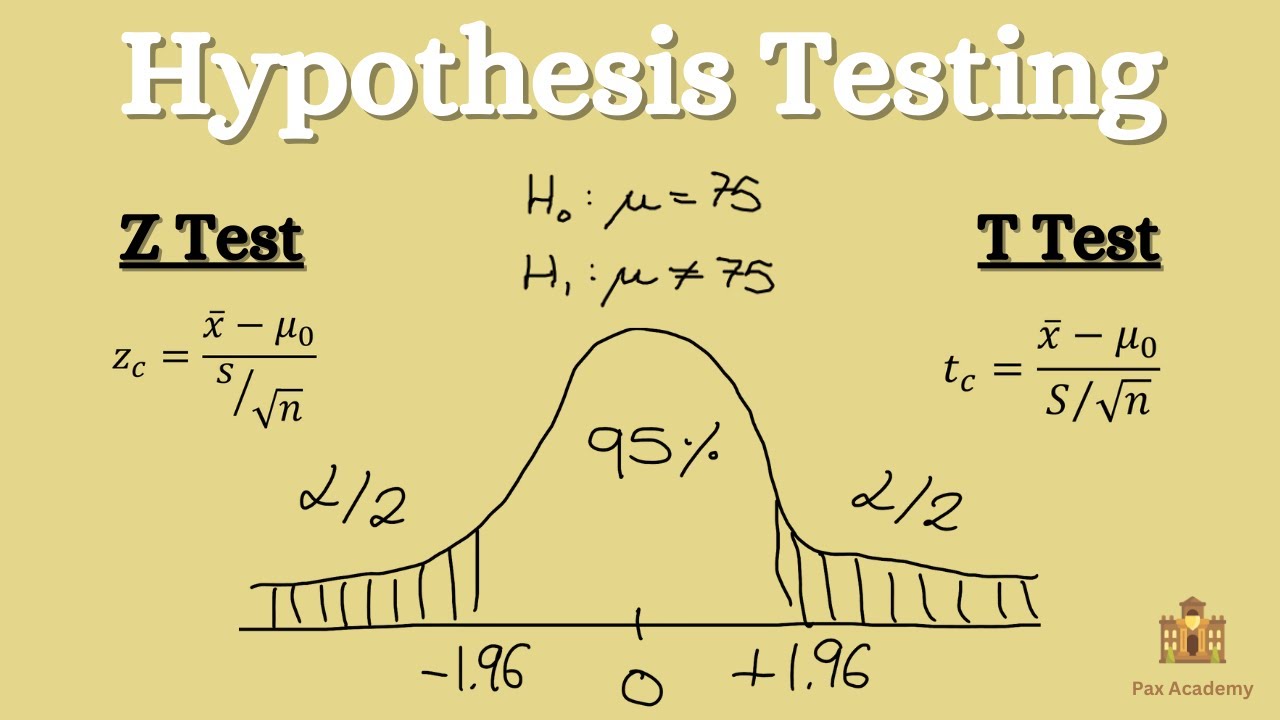
- 😀 In hypothesis testing, you test the null hypothesis (H₀) against the alternative hypothesis (H₁), deciding whether to reject or accept H₀ based on critical values.
- 😀 The formula for calculating the t-statistic involves the sample mean, population mean, sample standard deviation, and sample size.
- 😀 A two-tailed hypothesis test is used when testing if the mean is different from a specified value, either greater or smaller.
- 😀 In a two-tailed test, the significance level (alpha) is divided by two to account for both ends of the distribution.
- 😀 A practical example demonstrates testing whether a new class's average score (118) is different from the historical average (115) with a sample size of 20.
- 😀 The calculated t-statistic (0.67) is compared to the critical t-value (±2.093) from the t-distribution table, leading to the decision to accept the null hypothesis.
- 😀 The conclusion is that there is insufficient evidence to say that the new class's average score is significantly different from the historical average, so H₀ is not rejected.
Q & A
What is the main topic of this lesson?
-The lesson is focused on hypothesis testing for population mean, specifically when the population variance is unknown.
Why is the Student's t-distribution used in hypothesis testing with unknown population variance?
-The Student's t-distribution is used because it adjusts for the degrees of freedom when the sample size is small and the population variance is unknown.
What is the significance of the sample size in determining whether to use the t-distribution or normal distribution?
-If the sample size (n) is greater than 30, the normal distribution can be used as an approximation, even with unknown population variance. For smaller sample sizes, the t-distribution is preferred.
What is the formula for calculating the test statistic in hypothesis testing for a population mean?
-The test statistic (t) is calculated using the formula: (sample mean - population mean) / (sample standard deviation / sqrt(n)), where n is the sample size.
What does it mean if the calculated t-value is greater than the critical t-value from the table?
-If the calculated t-value exceeds the critical t-value, we reject the null hypothesis, suggesting that there is a significant difference between the sample mean and the population mean.
In the example with the students' test scores, what was the null hypothesis (H0)?
-The null hypothesis (H0) was that the population mean score of the new class is equal to the population mean score of previous classes, which was 115.
What was the sample size in the example, and how did it affect the test?
-The sample size was 20. Since this is a small sample, the t-distribution was used for the hypothesis test due to the unknown population variance.
How is the significance level (alpha) used in hypothesis testing?
-The significance level (alpha) determines the threshold for rejecting the null hypothesis. In the example, alpha was set at 0.05, meaning there is a 5% risk of rejecting a true null hypothesis.
What conclusion was drawn from the hypothesis test in the example?
-The conclusion was that there is not enough evidence to reject the null hypothesis. The new class's average score is not significantly different from the previous classes' average score.
What is the difference between a one-tailed and a two-tailed hypothesis test?
-In a one-tailed test, the alternative hypothesis is directional (greater than or less than), whereas in a two-tailed test, the alternative hypothesis tests for any difference (not equal to). In the example, a two-tailed test was used since the goal was to see if the new class's mean was different from 115, whether higher or lower.
Outlines

This section is available to paid users only. Please upgrade to access this part.
Upgrade NowMindmap

This section is available to paid users only. Please upgrade to access this part.
Upgrade NowKeywords

This section is available to paid users only. Please upgrade to access this part.
Upgrade NowHighlights

This section is available to paid users only. Please upgrade to access this part.
Upgrade NowTranscripts

This section is available to paid users only. Please upgrade to access this part.
Upgrade NowBrowse More Related Video


5.0 / 5 (0 votes)