Relations and Functions | Algebra
Summary
TLDRThis video script explores the concepts of relations and functions in mathematics. It explains that a relation is a set of pairs, with 'x' values representing the domain and 'y' values the range. The script teaches how to identify the domain and range of a relation and how to determine if a relation is a function, emphasizing that each input must have a unique output. It also introduces the vertical line test for graph-based relations, demonstrating how to use it to ascertain if a graph represents a function. Additionally, the script promotes the creator's website, video-dash-tutor.net, for specialized educational content.
Takeaways
- 📚 A relation is a set of ordered pairs of input and output values, with the x-values representing the domain and the y-values representing the range.
- 📝 To determine the domain and range of a relation, list all unique x-values in ascending order for the domain and all unique y-values in ascending order for the range.
- 🔍 A relation is a function if every input value has exactly one output value; if an input value corresponds to more than one output value, the relation is not a function.
- 🔑 To identify if a relation is a function, look for repeating x-values with different y-values, which indicates the relation is not a function.
- 🌐 The speaker promotes their website, video-dash-tutor.net, for specialized content and encourages joining an email list for updates on new materials.
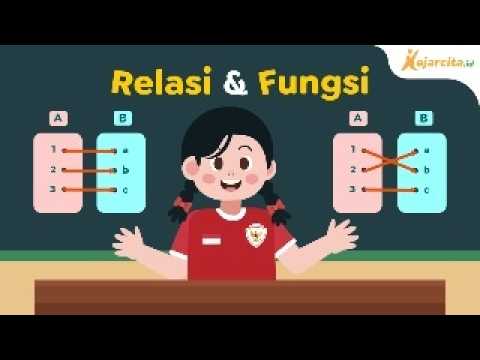
- 📈 A mapping diagram can be used to visualize the relation between domain and range values, helping to determine if the relation is a function by checking for one-to-one correspondence.
- 📊 A function table lists input values (domain) next to output values (range), and if there are identical x-values with different y-values, the relation is not a function.
- 📐 The vertical line test is a method to determine if a graph represents a function; if any vertical line intersects the graph at more than one point, the graph does not represent a function.
- ⭕ For a circle, the vertical line test will fail because a vertical line will intersect a circle at two points, indicating it does not represent a function.
- 📉 The vertical line test confirms a relation as a function only if every vertical line touches the graph at exactly one point, ensuring a one-to-one correspondence between domain and range.
- 📚 The video script provides a comprehensive guide on understanding relations and functions, including how to list domain and range, identify functions, and apply the vertical line test.
Q & A
What is a relation in the context of the video?
-A relation is a set of pairs of input and output values, where each input value (x) is associated with a domain and each output value (y) is associated with a range of the relation.
How do you determine the domain of a relation?
-The domain of a relation is determined by making a list of all the x values, which are the input values, and writing them in ascending order.
What is the range of a relation and how is it found?
-The range of a relation is the set of all possible output values (y values). It is found by listing the y values in ascending order.
What is the difference between a relation and a function?
-A relation becomes a function only if every input value has exactly one output value. If an input value corresponds to two or more output values, the relation is not a function.
How can you quickly determine if a relation is not a function?
-You can quickly determine if a relation is not a function by looking for repeating x values that correspond to different y values.
What is a mapping diagram and how is it used in the context of the video?
-A mapping diagram is a visual representation of a relation where the domain (x values) is arranged on one side and the range (y values) on the other, showing the correspondence between each input and output value. It helps to determine if a relation is a function by checking for one-to-one correspondence.
What is a function table and how does it help in determining if a relation is a function?
-A function table is a tabular representation of a relation that lists input values (x values) alongside corresponding output values (y values). It helps in determining if a relation is a function by showing if there are any identical x values with different y values, which would indicate it is not a function.
What is the vertical line test and how is it used to determine if a graph represents a function?
-The vertical line test is a method used to determine if a graph represents a function by drawing vertical lines across the graph. If the line touches the graph at more than one point, the graph does not represent a function. If it only touches at one point, it does represent a function.
Why does the circle in the video's example not represent a function according to the vertical line test?
-The circle does not represent a function because, when applying the vertical line test, a vertical line touches the circle at more than one point, indicating that there are multiple output values for at least one input value.
What is the significance of the website video-tutor.net mentioned in the video?
-The website video-tutor.net is mentioned as a resource for those who want to be notified about specialized content such as videos, ebooks, articles, digital courses, or podcasts released by the video creator. It also provides access to a page with all of the creator's playlists, including final exam and test prep videos.
How can one join the email list on video-tutor.net to get access to additional content?
-To join the email list on video-tutor.net, one needs to sign up on the website. After confirming their email, they will gain access to a page listing all of the creator's playlists, including specialized content for exams and test preparation.
Outlines
📚 Understanding Relations and Functions
This paragraph introduces the concept of relations and functions in mathematics. A relation is defined as a set of pairs consisting of input (x values) and output (y values). The domain of the relation is the set of all unique x values, while the range is the set of all unique y values. The paragraph explains how to list the domain and range for two given relations, emphasizing the importance of listing them in ascending order. It also discusses the criteria for a relation to be considered a function: each input value must correspond to exactly one output value. The paragraph provides examples to illustrate this, noting that if an input value corresponds to multiple output values, the relation is not a function. The speaker also promotes their website, video-tutor.net, for specialized content and resources.
📈 Mapping Diagrams and Function Tables
The second paragraph delves into visual representations of relations through mapping diagrams and function tables. It explains how to create a mapping diagram by arranging the domain (x values) and range (y values) and connecting corresponding pairs. The paragraph clarifies that if each input value has a unique output value, the relation is a function. Conversely, if there are repeating x values with different y values, the relation is not a function. The speaker also demonstrates how to construct a function table, listing input and output values side by side, and points out the importance of matching values in the table. The paragraph concludes with an example of a relation that is not a function due to the presence of identical x values with different y values.
📊 Vertical Line Test for Function Determination
The final paragraph discusses the use of the vertical line test to determine whether a graph represents a function. The vertical line test involves drawing a vertical line across the graph; if the line intersects the graph at more than one point, the relation is not a function. The paragraph provides examples of graphs that pass and fail the vertical line test, including a circle, which does not represent a function because it intersects a vertical line at multiple points. The speaker emphasizes that for a graph to represent a function, it must touch a vertical line at only one point, ensuring that each input value corresponds to a single output value.
Mindmap
Keywords
💡Relation
💡Domain
💡Range
💡Function
💡Ordered Pairs
💡Vertical Line Test
💡Mapping Diagram
💡Function Table
💡Input Value
💡Output Value
💡Video-dash-Tutor.net
Highlights
A relation is defined as a set of pairs of input and output values.
The domain of a relation consists of all unique x-values, while the range consists of all unique y-values.
To determine the domain and range, list all x-values in ascending order for the domain and y-values for the range.
A relation is a function if every input value has exactly one output value.
The first relation is a function because each input value corresponds to a unique output value.
The second relation is not a function due to the same input value (-2) corresponding to two different output values (4 and 7).
A quick way to identify a non-function is by looking for repeating x-values with different y-values.
The presenter introduces their website, video-dash-tutor.net, for specialized educational content.
Joining the email list on the website provides access to playlists including final exam and test prep videos.
A mapping diagram can be used to visualize the domain and range of a relation.
If a mapping diagram shows an x-value corresponding to one y-value, the relation is a function.
If an x-value corresponds to multiple y-values in a mapping diagram, the relation is not a function.
A function table lists input and output values, representing the domain and range of a relation.
Identical x-values with different y-values in a function table indicate the relation is not a function.
The vertical line test is a method to determine if a graph represents a function.
A graph passes the vertical line test if no vertical line intersects the graph at more than one point.
A circle does not represent a function as it fails the vertical line test by intersecting a vertical line at multiple points.
A graph that passes the vertical line test at every point represents a function.
Transcripts
in this video we're going to focus on
relations and functions
so what is a relation
a relation is a set of pairs of input
and output values
here we have three ordered pairs
in the first relation on the left
the x value
is the input value
the y value is the output value
the x values is associated with the
domain of the relation the y values is
associated with
the range of the relation
so now let's focus on part a list the
domain and range of each relation
so let's start with the domain
so what we're going to do is we're going
to make a list of all of the x values
and i'm going to write it in ascendant
order
so first we have negative three
and then zero
and two
now let's write the range
of that relation
so we're going to focus on
the y values and it's already listed in
ascendant order
so 1 4
and 5.
now let's do the same thing for the
other relation
so let's write out the domain
so the lowest
x value is negative two
next is one and then three
now let's write out the range
of that relation
the lowest y value
is negative two
and then it's
three four and seven
so that's how you can write out the
domain and range of each relation
now how can we determine if the relation
is a function
in order for the relation to be a
function
every input value
must have
only one output value
if an input value corresponds to two or
more output values
that relation is not a function
now
let's focus on the first relation
so we have the ordered pair 2 1 the
input value is 2 the output value is 1.
and then negative 3 4. so negative 3
corresponds to 4
and then 0 corresponds to 5.
so for the first relation we can see
that
for every input value there's only one
output value
now let's focus on the second relation
so we have the ordered pair one comma
three
next is negative two four
and then it's three negative two
and then finally negative two seven
so for the second relation notice that
negative two corresponds
to two different output values
now that's a problem
if you put in an input value of negative
two should the output be four or seven
so whenever you have that situation you
know that relation
is not
a function
the first one is a function
every input value corresponds to an
output value just one output value
so a quick way to
look at a relation to see if it's
if it's not going to be a function
look for repeating x values
if you see
two x values that are the same
but correspond to two different y values
then you know the relation is not a
function
i want to take a minute to talk about
my website
video dash tutor.net
it's a very simple website not too
complicated
but for those of you who want to be
notified
anytime i release specialized content
in the form of a video
an ebook
an article
it could be a digital course or podcast
if you want to be notified
feel free to join the email list
and once you confirm your email
you're going to get access to a page
that has all of my playlists
listed on it
and this includes my final exam videos
and also
my test prep videos so feel free to join
the email list when you get a chance
and let's get back to the video
now let's move on to the next example
draw a mapping diagram of each relation
shown below
so let's start with the relation on the
left
we're going to map out the domain and
arrange
so for the domain we have the values
negative 2
1 and 3.
for the range we have the y values
negative 6
0
and 4.
now negative two
corresponds to zero
one corresponds to four
three
corresponds to negative six
so for every input value on the domain
side there's one corresponding
output value on a range side
so this
is a relation
i mean
this relation is a function so the
answer is yes for
the first relation
now let's move on to the second
relation
so let's create a mapping diagram as
well
so let's start with the domain
the lowest x value is negative two
next we have
zero
and then the last one is three
now looking at the y values
the lowest one is negative one
and then it's going to be one
two and five
so negative two corresponds
to positive one
zero corresponds to five
three corresponds to two
and zero
corresponds to negative one
so just by seeing
the repeat x values that we see here we
could tell that
this is not going to be
a function
the two x values have two different y
values
you can see zero points to negative one
and five
so the second relation
is not
a function
now for this one what we're going to do
is we're going to draw a function table
of the relation
and then we're going to determine if the
relation is a function
so in this table we're going to list
the input values
next to the output values
the input values represent the x values
the output values represent the y values
so the input values it corresponds to
the domain and the output values
corresponds to the range
so the lowest input value that we have
is negative three
next
is one
and then we have another one
and then after that is
it's three and five
now for this function table
i'm going to write the input value twice
because that's what we have here
when writing out
the domain and the range
for repeat values we would write repeat
values once
now negative three corresponds to two
for the table
these numbers need to match so i'm not
going to list the output values in
ascendant order
now for this one
we could use either one so i'm going to
use 1 2 for the next one and then 1 4.
now when x is 3 y is 7
and when x is 5 y is negative 4.
so that's the function table
and because we have
two identical x values that correspond
to two different y values
we know that this relation
is not
a function
so that's it for this problem
when you have a graph
the best way to determine if the graph
represents a function is to use the
vertical line test and that's what we're
going to do in this problem
so any way you draw a vertical line
for the first graph notice that
the line only touches the graph at one
point
therefore
this is the answer is yes it represents
a function
for the next one on the right if we draw
a vertical line
notice at
this point or place a line at that
location
we have
three points of intersection between a
graph and a vertical line
if we can get two or more points on a
vertical line then a relation is not a
function so we're going to say no
now if we put the vertical line here
notice that we have five points on that
line
so this relation is not a function
for the next relation
it doesn't matter where we put the graph
we will only get
i mean doesn't matter where we put the
vertical line we're only going to get
one point
if we put it here
it's only going to touch the line once
so we can't draw a vertical line where
it touches two points therefore
this relation represents a function
for the circle
if we put the line here
we can get two points of intersection
so we're going to say yes i mean no not
yes
this is no
the circle does not represent a function
it does not pass the vertical line test
it touches the line
at two points in order for it to pass
the vertical line test the graph must
touch the line only at one point
as we
saw in these two cases
so that's how you can use the vertical
line test to determine
if a relation represented by a graph
is a function
Weitere ähnliche Videos ansehen
THE LANGUAGE OF RELATIONS AND FUNCTIONS || MATHEMATICS IN THE MODERN WORLD
Relations and Functions | General Mathematics | Grade 11
Functions - Vertical Line Test, Ordered Pairs, Tables, Domain and Range
Relation and Functions || MATHEMATICS IN THE MODERN WORLD
MCR3U (1.1) - Relations vs Functions - Grade 11 Functions
Functions
5.0 / 5 (0 votes)