ROC and AUC, Clearly Explained!
Summary
TLDRIn this StatQuest episode, Josh Starmer elucidates the concepts of ROC (Receiver Operating Characteristic) and AUC (Area Under the Curve) using logistic regression as an example. He explains how to transform probabilities into classifications by adjusting thresholds and evaluates the effectiveness through a confusion matrix. The video demonstrates the construction of an ROC graph to compare different thresholds and the significance of AUC in determining the optimal classification method, providing a practical guide for decision-making in binary classification problems.
Takeaways
- 📊 The script introduces ROC (Receiver Operating Characteristic) and AUC (Area Under the Curve) as important concepts in statistical analysis, particularly in the context of logistic regression.
- 🧩 It builds upon the understanding of the confusion matrix, sensitivity, and specificity, suggesting viewers to review previous content if they are not familiar with these topics.
- 🐭 The example used in the script is based on classifying mice as obese or not obese based on their weight, with logistic regression used to model the probability of obesity.
- 📈 The logistic regression curve is used to represent the probability of a mouse being obese given its weight, allowing for the prediction of obesity based on this probability.
- 🔄 The concept of a classification threshold is explained, with the common default threshold of 0.5 used to classify mice into obese or not obese categories.
- 🤔 The script discusses the implications of choosing different thresholds for classification, emphasizing the trade-off between sensitivity (true positive rate) and the number of false positives.
- 📉 The ROC graph is introduced as a tool to visualize and compare the performance of different classification thresholds, with the true positive rate on the y-axis and the false positive rate on the x-axis.
- 📌 The process of creating a ROC graph is demonstrated step by step, showing how each threshold results in a different point on the graph, with the best thresholds being those farthest from the diagonal line.
- 🔢 The AUC is presented as a summary statistic that quantifies the overall performance of the classification model, with a higher AUC indicating a better model.
- 🔄 The script mentions that while ROC graphs typically use true positive rates and false positive rates, other metrics like precision could be used in situations where there is an imbalance in the data, such as rare diseases.
- 🎓 In summary, the script provides a comprehensive explanation of ROC and AUC, their importance in evaluating classification models, and how to use them to determine the optimal threshold for classification.
Q & A
What are ROC and AUC in the context of logistic regression?
-ROC (Receiver Operating Characteristic) and AUC (Area Under the Curve) are metrics used to evaluate the performance of a classification model. ROC is a graph that plots the true positive rate (sensitivity) against the false positive rate (1 - specificity) at various threshold settings. AUC represents the degree or measure of separability achieved by the model, with a higher AUC indicating a better model.
What is the significance of the confusion matrix in evaluating a logistic regression model?
-A confusion matrix is a table used to describe the performance of a classification model on a set of data for which the true values are known. It summarizes the counts of true positives, true negatives, false positives, and false negatives, which are essential for calculating sensitivity, specificity, and other performance metrics.
How does the choice of threshold affect the classification of a logistic regression model?
-The threshold determines the probability value at which a sample is classified as the positive class (e.g., obese). A lower threshold increases the number of true positives but also increases false positives, while a higher threshold reduces false positives but can lead to more false negatives.
What is the purpose of the ROC curve in model evaluation?
-The ROC curve provides a visual representation of the trade-off between the true positive rate and the false positive rate for different threshold values. It allows for the comparison of different models or different thresholds of the same model to determine the optimal balance between sensitivity and specificity.
How is the AUC calculated, and what does it represent?
-The AUC is calculated by measuring the area under the ROC curve. It represents the likelihood that the model will rank a randomly chosen positive instance higher than a randomly chosen negative one, with an AUC of 1 indicating perfect classification and an AUC of 0.5 indicating no discrimination.
What is the relationship between sensitivity and the true positive rate?
-Sensitivity and the true positive rate are equivalent. They both represent the proportion of actual positive cases that were correctly identified by the model, calculated as true positives divided by the sum of true positives and false negatives.
What is specificity, and how is it related to the false positive rate?
-Specificity is the ability of a model to correctly identify negative cases. It is calculated as true negatives divided by the sum of true negatives and false positives. The false positive rate is one minus the specificity, representing the proportion of actual negative cases that were incorrectly classified as positive.
Why might a lower threshold be chosen for a classification task, even if it results in more false positives?
-A lower threshold might be chosen if it is critical to minimize false negatives, such as in the case of a disease outbreak where it is essential to correctly identify all infected individuals to prevent the spread of the disease, even if it means accepting more false positives.
What is the importance of the optimal threshold in a classification model?
-The optimal threshold is the value that best balances the trade-off between true positives and false positives for a specific application. It is important because it determines the model's ability to accurately classify instances, affecting the model's overall effectiveness and reliability.
Can you explain the concept of a false positive and its implications in a classification task?
-A false positive occurs when a classification model incorrectly classifies a negative instance as positive. In practical terms, this could mean diagnosing a healthy person as sick or identifying a non-event as an event. The implications can include unnecessary treatments, wasted resources, and potential harm from false alarms.
Why might precision be a more useful metric than the false positive rate in certain situations?
-Precision might be more useful than the false positive rate when dealing with imbalanced datasets, such as when studying a rare disease. Precision focuses on the proportion of positive results that are correctly classified, without considering the true negatives, making it a more relevant metric when the number of non-obese samples is much larger than the number of obese samples.
Outlines

Dieser Bereich ist nur für Premium-Benutzer verfügbar. Bitte führen Sie ein Upgrade durch, um auf diesen Abschnitt zuzugreifen.
Upgrade durchführenMindmap

Dieser Bereich ist nur für Premium-Benutzer verfügbar. Bitte führen Sie ein Upgrade durch, um auf diesen Abschnitt zuzugreifen.
Upgrade durchführenKeywords

Dieser Bereich ist nur für Premium-Benutzer verfügbar. Bitte führen Sie ein Upgrade durch, um auf diesen Abschnitt zuzugreifen.
Upgrade durchführenHighlights

Dieser Bereich ist nur für Premium-Benutzer verfügbar. Bitte führen Sie ein Upgrade durch, um auf diesen Abschnitt zuzugreifen.
Upgrade durchführenTranscripts

Dieser Bereich ist nur für Premium-Benutzer verfügbar. Bitte führen Sie ein Upgrade durch, um auf diesen Abschnitt zuzugreifen.
Upgrade durchführenWeitere ähnliche Videos ansehen
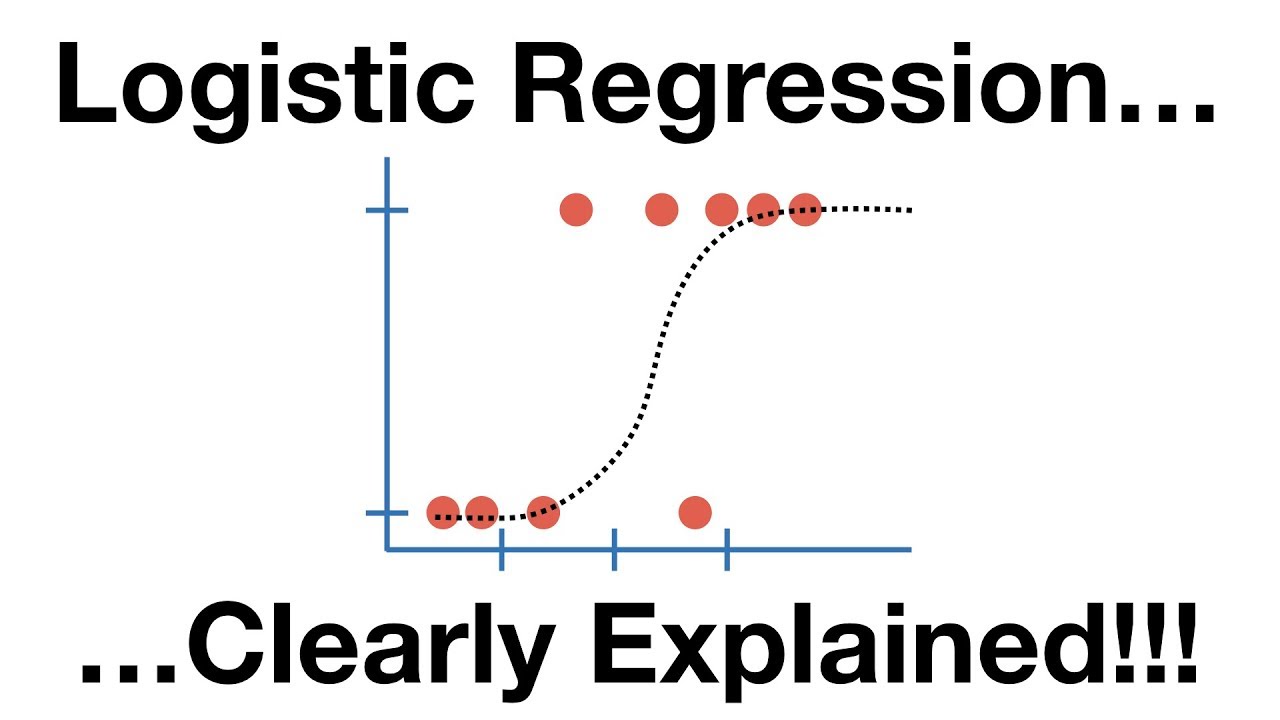
StatQuest: Logistic Regression
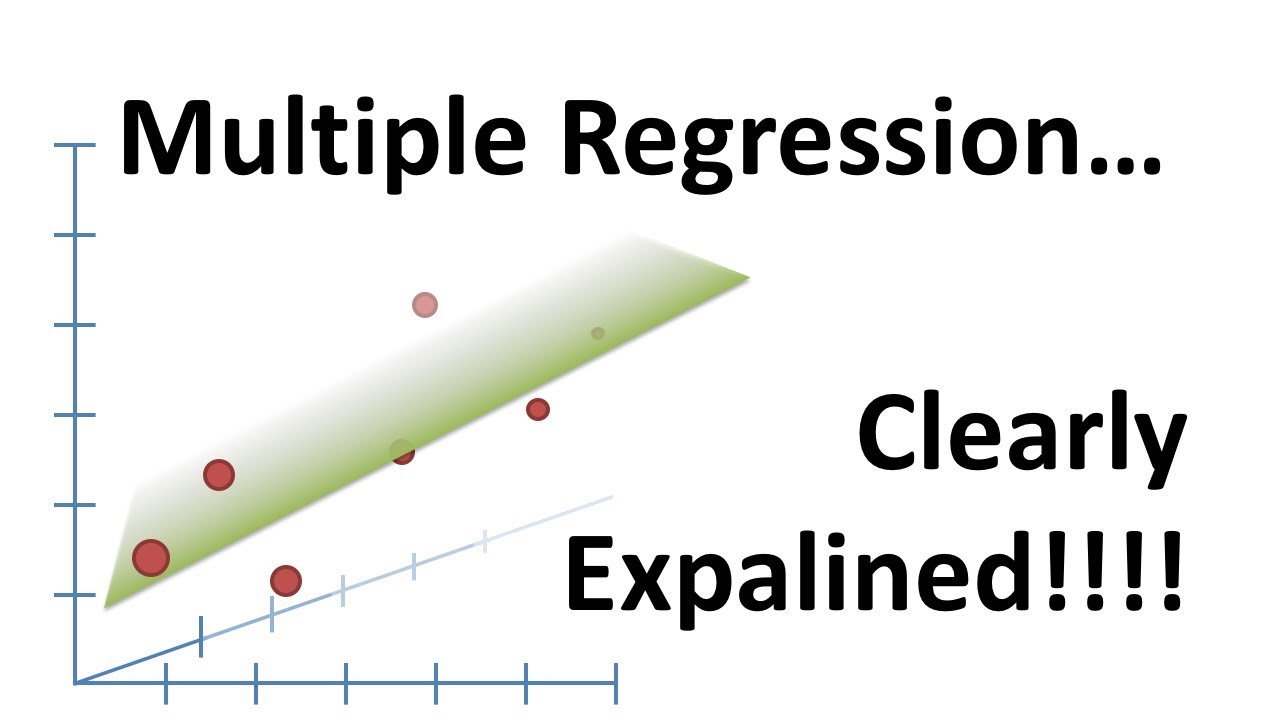
Multiple Regression, Clearly Explained!!!
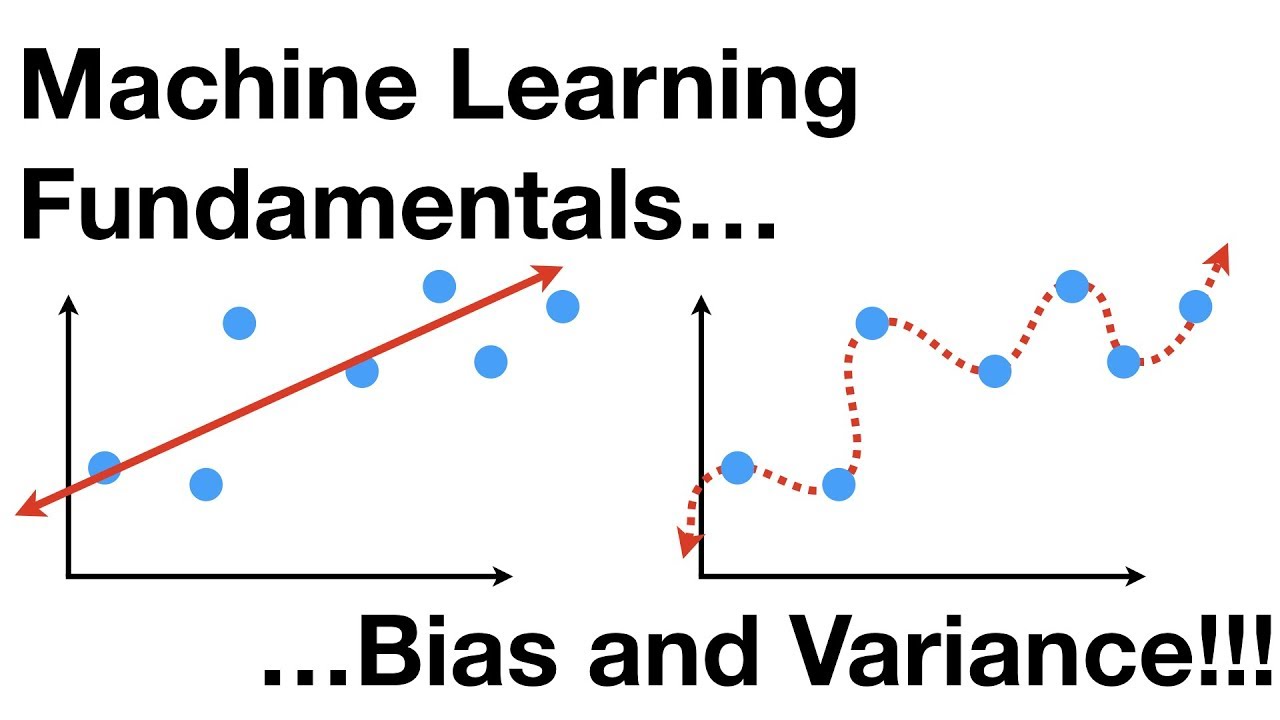
Machine Learning Fundamentals: Bias and Variance

Neural Networks Part 8: Image Classification with Convolutional Neural Networks (CNNs)
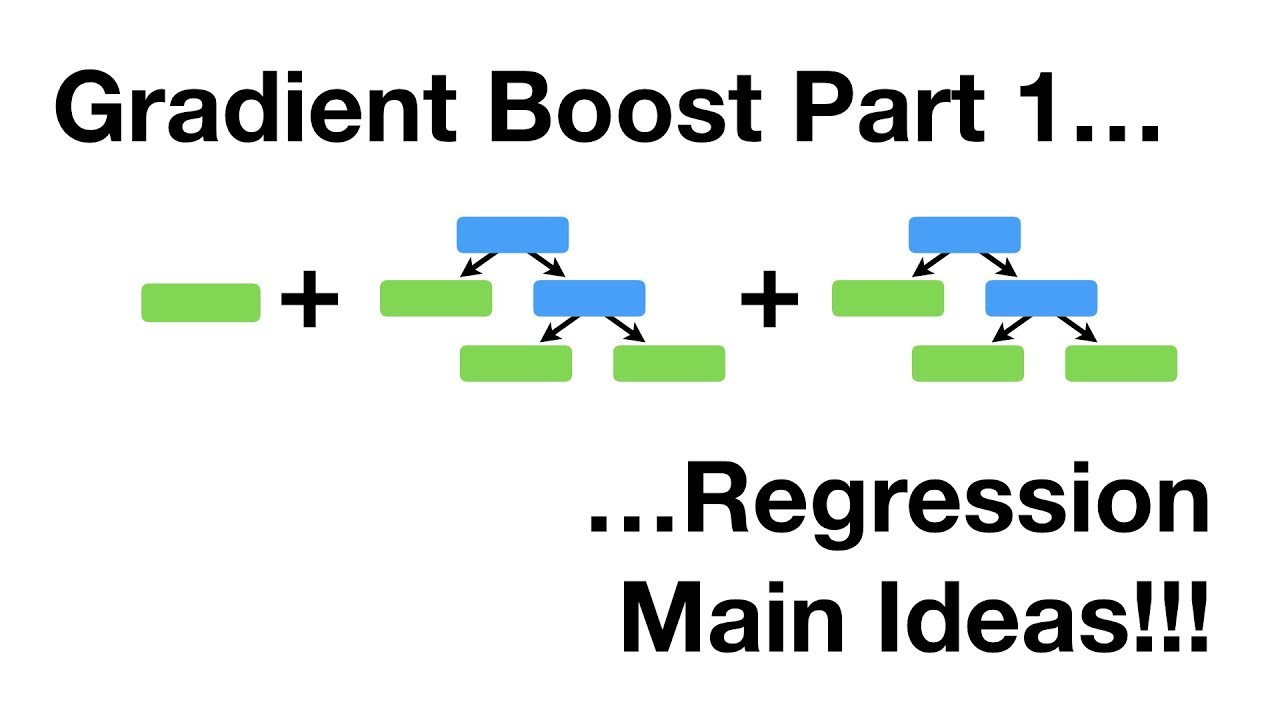
Gradient Boost Part 1 (of 4): Regression Main Ideas

UMAP: Mathematical Details (clearly explained!!!)
5.0 / 5 (0 votes)
