Ubah Chart jadi Cuan Dengan Technical Analysis! Langsung Praktek
Summary
TLDRIn this video, the instructor introduces technical analysis for trading, focusing on tools like TradingView, Moving Averages (MA), Bollinger Bands, RSI, and Ichimoku Clouds. The lesson explains how to read trends, predict price movements, and effectively use indicators to make informed trading decisions. Emphasizing a hands-on approach, the instructor breaks down complex concepts into manageable steps, encouraging users to focus on key indicators rather than overwhelming details. The video aims to help viewers understand market structure and follow trends, offering valuable insights into making better trades and managing risks, especially with leverage.
Takeaways
- 😀 Understanding Technical Analysis is essential for making informed decisions in trading, helping to predict market movements and trends.
- 📊 Tools like TradingView provide visual aids (charts, indicators) to assist in analyzing price action and trends across various financial instruments.
- 📉 Moving Averages (MA) and Bollinger Bands are key indicators used to assess price trends, while Ichimoku Cloud helps in identifying support and resistance levels.
- 💡 Indicators like RSI and MACD are used to gauge momentum, providing insights into when an asset may be overbought or oversold.
- 🕹️ Trend lines are crucial for identifying whether an asset is in an uptrend, downtrend, or moving sideways (ranging).
- 🔍 Technical analysis allows traders to follow trends effectively, utilizing strategies such as 'buy low, sell high' and 'follow the trend.'
- 🎯 Using a combination of different tools helps validate predictions and gives a clearer picture of when to enter or exit a trade.
- ⏳ Time frames in TradingView, such as daily or weekly, play an important role in analyzing the market and determining the optimal points for trade execution.
- 📈 Market structure and price action are critical to understanding when to take advantage of trends, regardless of whether the market is bullish or bearish.
- 💡 The value of technical analysis lies in its ability to read and predict market behaviors, allowing traders to maximize profits and minimize losses, especially when used with leverage.
Q & A
What is the main purpose of technical analysis in trading?
-The main purpose of technical analysis in trading is to predict future price movements by analyzing past market data, mainly through charts and indicators. It helps traders identify trends, entry and exit points, and market conditions.
What is TradingView, and why is it used for technical analysis?
-TradingView is a popular charting platform used by traders to analyze financial markets. It offers various charting tools and indicators that help traders visualize price movements, trends, and other market patterns. It is widely used due to its user-friendly interface and extensive functionality.
What are the three types of market trends mentioned in the script?
-The three types of market trends mentioned are uptrend, downtrend, and sideways (ranging). An uptrend is characterized by rising prices, a downtrend by falling prices, and sideways is when prices fluctuate within a specific range.
What is the importance of identifying the trend in trading?
-Identifying the trend is crucial in trading because it helps traders align their positions with the prevailing market direction. This increases the likelihood of making profitable trades, as trends often continue in the same direction for some time.
What are Bollinger Bands, and how are they used in technical analysis?
-Bollinger Bands are a technical indicator that consists of three lines: a simple moving average (SMA) and two standard deviation lines above and below it. They are used to identify overbought or oversold conditions, as well as to gauge the volatility of a market.
How does the Moving Average Convergence Divergence (MACD) indicator help traders?
-The MACD indicator helps traders identify changes in the strength, direction, momentum, and duration of a trend. It consists of two moving averages, and traders use it to spot potential buy or sell signals when the MACD crosses its signal line.
What is the role of RSI (Relative Strength Index) in technical analysis?
-The RSI is a momentum oscillator that measures the speed and change of price movements. It helps traders identify overbought or oversold conditions in the market, typically with values above 70 indicating overbought and below 30 indicating oversold.
What does the Ichimoku Cloud indicate about market trends?
-The Ichimoku Cloud is a versatile indicator used to identify trends, momentum, and support/resistance levels. If the price is above the cloud, it suggests an uptrend, while if it's below the cloud, it indicates a downtrend. When the price is within the cloud, it typically suggests a sideways market.
What is the significance of drawing trendlines in technical analysis?
-Drawing trendlines is important for identifying the direction of the market. A trendline connects significant highs or lows, and it helps traders understand whether the market is in an uptrend, downtrend, or sideways. It also helps in identifying breakout and breakdown points.
How can Fibonacci retracement be used in trading?
-Fibonacci retracement is a tool used to identify potential levels of support and resistance in a market. By plotting key Fibonacci levels (such as 23.6%, 38.2%, 50%, 61.8%), traders can estimate areas where price corrections may occur during a trend.
Outlines

Dieser Bereich ist nur für Premium-Benutzer verfügbar. Bitte führen Sie ein Upgrade durch, um auf diesen Abschnitt zuzugreifen.
Upgrade durchführenMindmap

Dieser Bereich ist nur für Premium-Benutzer verfügbar. Bitte führen Sie ein Upgrade durch, um auf diesen Abschnitt zuzugreifen.
Upgrade durchführenKeywords

Dieser Bereich ist nur für Premium-Benutzer verfügbar. Bitte führen Sie ein Upgrade durch, um auf diesen Abschnitt zuzugreifen.
Upgrade durchführenHighlights

Dieser Bereich ist nur für Premium-Benutzer verfügbar. Bitte führen Sie ein Upgrade durch, um auf diesen Abschnitt zuzugreifen.
Upgrade durchführenTranscripts

Dieser Bereich ist nur für Premium-Benutzer verfügbar. Bitte führen Sie ein Upgrade durch, um auf diesen Abschnitt zuzugreifen.
Upgrade durchführenWeitere ähnliche Videos ansehen

3 Technicals Reasons Why ES Will Hit 5450

Simple Method To Make $100 A Day Trading Cryptocurrency As A Beginner | Binance Tutorial Guide

(Technical Research) - 01. Cara Melakukan Trend Analysis
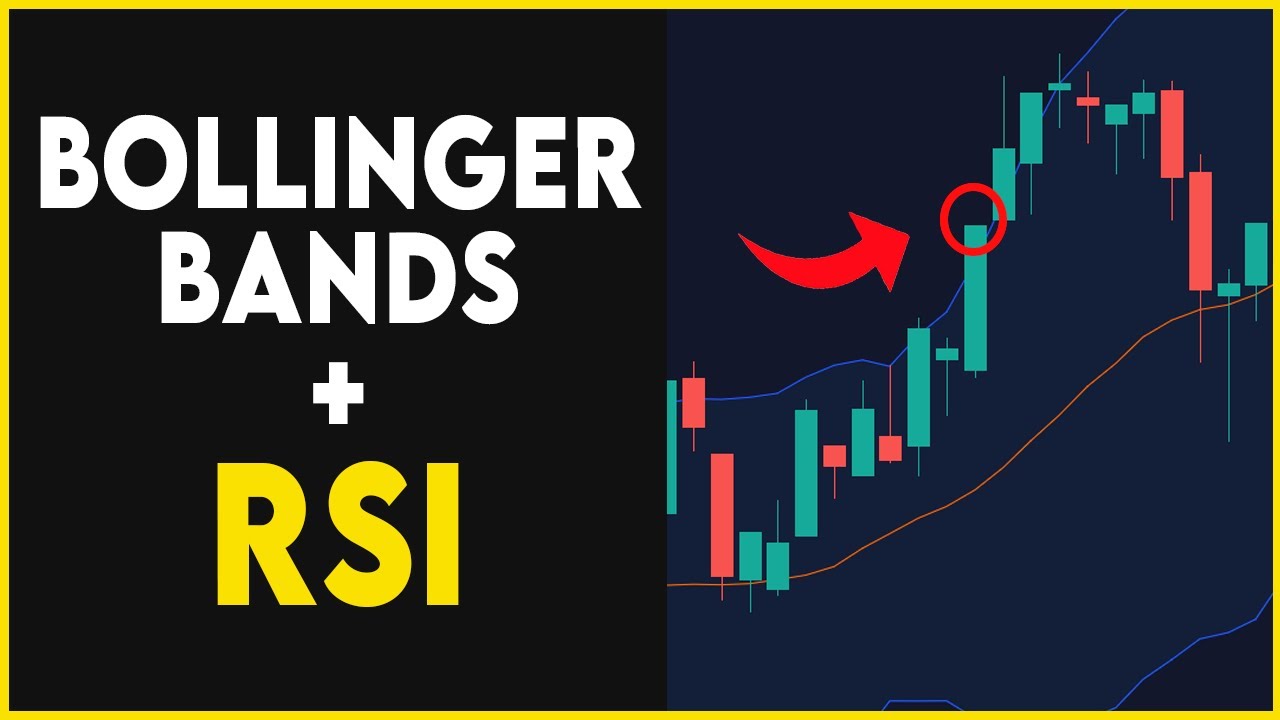
Bollinger Band + RSI Trading Strategy That Actually Works
【日本株爆益戦略④】超勝率が上がる大暴落回避パターン!!これを知れば損失回避&利益に繋がるぞ!!これで皆損失を回避してるで。米国株、FX、仮想通貨何でも使える‼️

10. Technical indicators
5.0 / 5 (0 votes)
