NVDA Stock - Can NVIDIA See Fresh All Time Highs ?
Summary
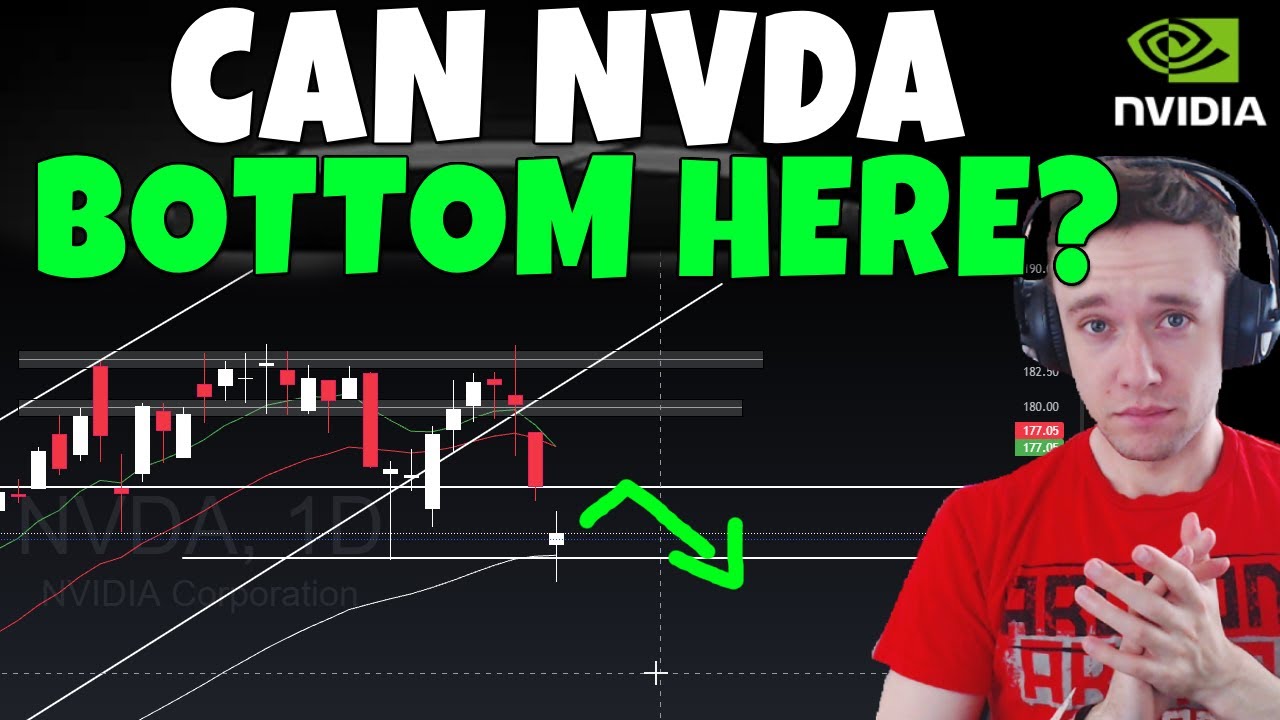
TLDRIn this Nvidia daily update, the host reviews the stock's minimal movement on an extremely low-volume day, highlighting a key trading range of $174–$181. Technical analysis shows a potential bull flag setup if consolidation occurs near $174, while a lower high at the green Fibonacci suggests slight bearishness. Key indicators like MACD and EMAs hint at cautious optimism for bulls, with breakout potential toward $200. The broader market remains mostly bullish, particularly the Nasdaq, though SPY shows slight weakness and bearish divergence. Overall, the video emphasizes careful monitoring of critical levels and possible scenarios for Nvidia and market trends in the coming week.
Takeaways
- 📉 Nvidia had a very low-volume day, showing minimal movement with only a 0.36% increase.
- 📊 The stock is currently trading within a key range of $174–$181, which is critical for short-term direction.
- ⚠️ Technical indicators suggest a potential lower high, indicating a slightly bearish bias until bullish confirmation appears.
- 🚀 Bull case: A consolidation near $174 forming a bull flag could lead to a breakout and fresh all-time highs, potentially approaching $200.
- 📉 Bear case: A breakdown below $174, especially toward $170–$169, could trigger a decline to around $150.
- 📈 MACD is cooling and forming higher lows, while the stock has reclaimed bullish EMAs, showing some potential for a bullish setup.
- 💸 Nvidia continues to absorb options premium, making it a stock that favors selling options due to chop within the current range.
- 📊 Broader market: Qs (NASDAQ) remains bullish above support at 575, while SPY (S&P 500) shows caution with bearish divergences in RSI and MACD.
- -
- 🔑 Key levels to watch: $174 (support), $181 (resistance), with further bearish targets at $170–$169 and bullish targets near $200.
- ⏳ Outlook: Expect continued range-bound chop in Nvidia until a clear breakout or breakdown occurs; daily monitoring is recommended.
- 📌 Overall, while Nvidia shows mixed signals, the bulls are not out of the game, but caution is advised due to the potential lower high formation.
Q & A
What was the main topic of the Nvidia daily update video?
-The video primarily focused on Nvidia's stock performance, analyzing its recent price movement, technical levels, and potential future scenarios.
How did Nvidia perform on the day of the update?
-Nvidia had a very modest gain of 0.36%, with extremely low trading volume, indicating little overall movement.
What are the key technical levels for Nvidia mentioned in the video?
-The most important levels are $181 as resistance and $174 as support, with lower support levels around $170–$169 and a potential bearish target near $150.
What is the current technical bias for Nvidia according to the video?
-The presenter leans slightly bearish due to a lower high rejection at the green Fibonacci level, although bullish potential remains with MACD higher lows and reclaimed EMAs.
What are the potential bullish and bearish scenarios for Nvidia?
-Bullish: Consolidation around $174–$175 forming a bull flag, breakout above $181, possibly reaching $200. Bearish: Break below $174 or $170–$169, potentially retesting lower levels around $150.
Why does the presenter consider Nvidia a good stock for selling options?
-Because Nvidia tends to 'suck in premium' due to its frequent sideways movement, making it favorable for options-selling strategies rather than aggressive buying.
How did the broader market, including NASDAQ and S&P 500, perform according to the video?
-NASDAQ (Q’s) remained strong, making fresh all-time highs with bullish MACD. The S&P 500 (SPY) showed caution with a concerning daily candle and bearish divergence on MACD and RSI.
What market conditions could signal weakening according to the video?
-Breaking critical support levels—575 for the Q’s or 560–575 for SPY—could indicate potential market weakening and act as early warning signs.
How does the presenter suggest monitoring Nvidia going forward?
-By watching the $174–$181 range, observing consolidation patterns like bull flags, and monitoring technical indicators like MACD, EMAs, and Fibonacci levels for clearer directional cues.
What role did Tesla play in the video discussion?
-Tesla was highlighted as attracting more attention than Nvidia at the moment, with stronger market activity and options flow, making it a focus for traders.
What is the presenter's overall recommendation for traders regarding Nvidia?
-The presenter advises caution due to low movement and slightly bearish bias, recommending patience and waiting for more meaningful technical setups before taking aggressive positions.
What are the implications of the MACD and RSI divergence mentioned for the broader market?
-Bearish divergence between price movements and indicators like MACD and RSI suggests a potential slowdown or pullback in the broader market, warranting close attention to key support levels.
Outlines

Dieser Bereich ist nur für Premium-Benutzer verfügbar. Bitte führen Sie ein Upgrade durch, um auf diesen Abschnitt zuzugreifen.
Upgrade durchführenMindmap

Dieser Bereich ist nur für Premium-Benutzer verfügbar. Bitte führen Sie ein Upgrade durch, um auf diesen Abschnitt zuzugreifen.
Upgrade durchführenKeywords

Dieser Bereich ist nur für Premium-Benutzer verfügbar. Bitte führen Sie ein Upgrade durch, um auf diesen Abschnitt zuzugreifen.
Upgrade durchführenHighlights

Dieser Bereich ist nur für Premium-Benutzer verfügbar. Bitte führen Sie ein Upgrade durch, um auf diesen Abschnitt zuzugreifen.
Upgrade durchführenTranscripts

Dieser Bereich ist nur für Premium-Benutzer verfügbar. Bitte führen Sie ein Upgrade durch, um auf diesen Abschnitt zuzugreifen.
Upgrade durchführen


5.0 / 5 (0 votes)
