Tutorial Mengerjakan Uji Normality Statistika di SPSS
Summary
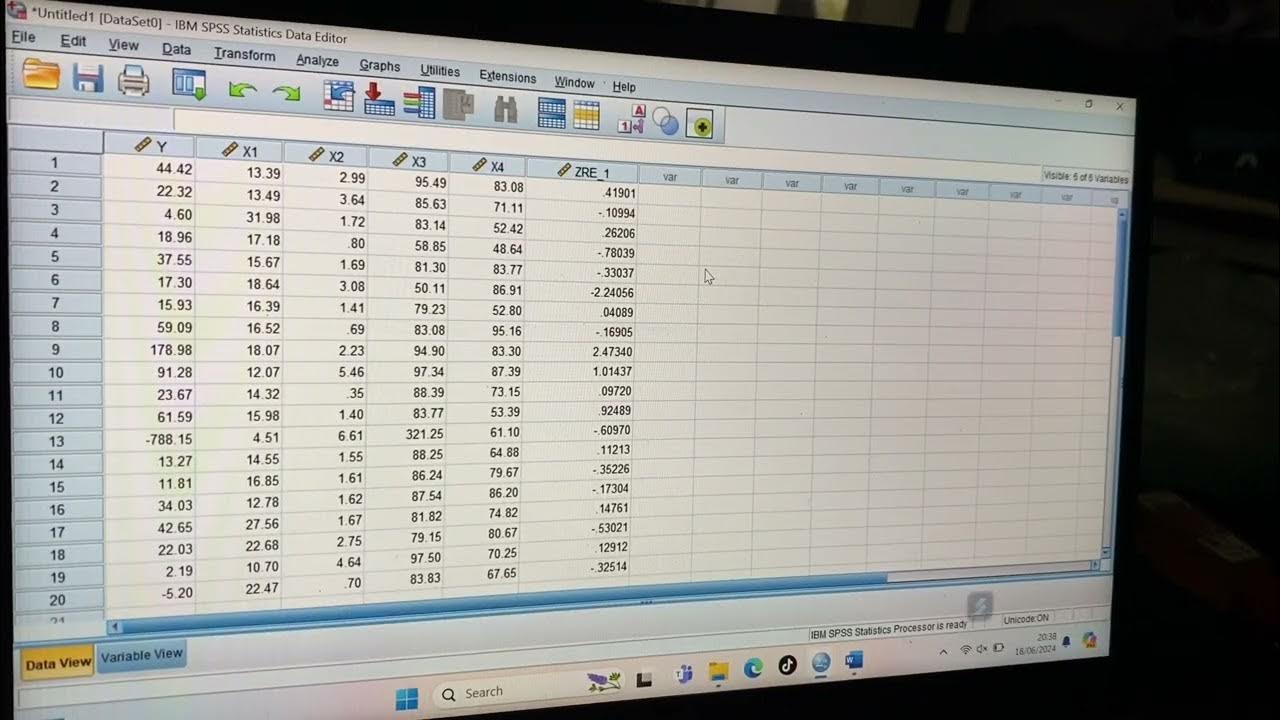
TLDRThis video provides a step-by-step guide on using SPSS to perform a normality test for data analysis. The presenter walks through the process of entering data into SPSS, aligning it properly, and selecting the correct variables for analysis. They demonstrate navigating the software's interface to run the normality test, including setting up the factor list and dependent list, and selecting the normality plot option. The output is then analyzed, showing the normality test results and key statistics such as mean and median, as well as graphical representations of the data's normality.
Takeaways
- 😀 The video explains how to use SPSS to perform a normality test for a final exam assignment.
- 😀 The user needs to create data in SPSS first before running the normality test.
- 😀 Data should be copied from the original set (1-13) and transferred into SPSS for analysis.
- 😀 After entering the data into SPSS, the user should assign scores to students in the appropriate columns.
- 😀 The scores should be placed in the 'score' column, with A1 to A13 representing individual data points.
- 😀 The video emphasizes the importance of properly arranging data for clarity and ease of analysis in SPSS.
- 😀 The process includes ensuring variables are appropriately labeled, such as students, scores, and data.
- 😀 The user should set the variable scale for scores and nominal for other data.
- 😀 In the SPSS interface, you can navigate to 'Analyze' > 'Descriptive Statistics' for the normality test setup.
- 😀 Plots and normality tests are accessed by selecting 'normality plot switch' under 'Plots' in SPSS.
- 😀 After completing the steps, SPSS will provide the normality test results along with additional statistical outputs like mean, median, and graphs.
Q & A
What is the first step in performing a normality test using SPSS?
-The first step is to create the data and enter it into SPSS, ensuring that both the students and their corresponding scores are properly recorded.
What variables need to be set up in SPSS for the normality test?
-You need to set up the variables such as 'Students' as the labels, 'Scores' as the dependent variable, and 'Data' as the factor list in the View Variable section.
What alignment options are available for the data in SPSS?
-You can choose from left-aligned, right-aligned, or centered alignment for the data in SPSS. Centering the data is often recommended for a neater presentation.
How do you enter the first and second data into SPSS?
-You copy both the first and second data and place them in SPSS under 'Students' and 'Scores'. Ensure both sets of data are placed correctly, with the first data in one column and the second data below it.
What is the role of the 'Plots' section when performing a normality test in SPSS?
-In the 'Plots' section, you need to enable the 'Normality Plot' option with the 'Status' switch to ensure that the normality test includes a graphical representation of the data distribution.
How do you access the normality test feature in SPSS?
-To access the normality test feature in SPSS, navigate to 'Analyze', then select 'Descriptive Statistics', and follow through to 'Export'. From there, you can select the necessary options to run the test.
What information does the normality test output in SPSS?
-The output of the normality test includes the mean, median, normality test results, and a graphical representation such as a Q-Q plot or histogram to assess the data's distribution.
What does the normality plot in SPSS show?
-The normality plot in SPSS visually shows whether the data follows a normal distribution, helping to determine the validity of applying parametric tests.
What should you do after setting up all variables and plots in SPSS?
-After setting up all the necessary variables and enabling the normality plot in the 'Plots' section, click 'OK' to run the normality test and generate the results.
What is the purpose of the normality test in SPSS?
-The purpose of the normality test in SPSS is to assess whether the data follows a normal distribution, which is a key assumption for many statistical tests.
Outlines

Dieser Bereich ist nur für Premium-Benutzer verfügbar. Bitte führen Sie ein Upgrade durch, um auf diesen Abschnitt zuzugreifen.
Upgrade durchführenMindmap

Dieser Bereich ist nur für Premium-Benutzer verfügbar. Bitte führen Sie ein Upgrade durch, um auf diesen Abschnitt zuzugreifen.
Upgrade durchführenKeywords

Dieser Bereich ist nur für Premium-Benutzer verfügbar. Bitte führen Sie ein Upgrade durch, um auf diesen Abschnitt zuzugreifen.
Upgrade durchführenHighlights

Dieser Bereich ist nur für Premium-Benutzer verfügbar. Bitte führen Sie ein Upgrade durch, um auf diesen Abschnitt zuzugreifen.
Upgrade durchführenTranscripts

Dieser Bereich ist nur für Premium-Benutzer verfügbar. Bitte führen Sie ein Upgrade durch, um auf diesen Abschnitt zuzugreifen.
Upgrade durchführenWeitere ähnliche Videos ansehen

Cara Uji Normalitas dan Homogenitas Menggunakan SPSS dengan Mudah

Tutorial Menggunakan Spss untuk data Panel

Uji Normalitas Shapiro Wilk Dengan SPSS

#2- UJI NORMALITAS DATA KELAS EKSPERIMEN DAN KELAS KONTROL MENGGUNAKAN SPSS

One Way Analysis of Variance

Tutorial SPSS Uji Asumsi Klasik : Uji Normalitas, Uji Multikolinearitas dan Uji Heteroskedastisitas
5.0 / 5 (0 votes)
