O que é CORRELAÇÃO e como analisar os Gráficos
Summary
TLDRIn this informative video, creator Jefferson explains the concept of correlation in data science, emphasizing its importance in predictive modeling and machine learning. He illustrates how to measure and interpret the strength and direction of correlations between variables using the correlation coefficient, ranging from -1 to 1. Through examples and visual aids like scatter plots and heat maps, viewers learn to identify weak, strong, and perfect correlations, and understand their significance in building intelligent models.
Takeaways
- 📊 Correlation is a vital concept in data science, measuring the relationship between two variables.
- 🔢 The correlation is quantified by a coefficient that ranges from -1 to 1, indicating the strength and direction of the relationship.
- 📈 A value close to 1 suggests a strong positive correlation, while a value near -1 indicates a strong negative correlation.
- ↔️ A correlation coefficient of exactly 1 or -1 represents a perfect positive or negative correlation, respectively.
- ➡️ As the script explains, a correlation of around 0 implies no correlation or a null relationship between variables.
- 📈 The script uses scatter plots to visually demonstrate the correlation between variables, such as the relationship between car age and value.
- 🚗 An example provided shows a positive correlation between car age and its value, indicating that newer cars have higher values.
- 🔍 The script also illustrates a negative correlation, such as between car engine size (cylinders) and fuel consumption, where larger engines tend to consume more fuel.
- 📊 The Hit map is introduced as a visual tool to interpret correlation coefficients, showing the strength of relationships through color gradients.
- 📉 The diagonal of the Hit map always shows a correlation of 1, representing the relationship of a variable with itself.
- 🔑 Understanding correlation is crucial for predictive modeling in machine learning and artificial intelligence, as it helps in assigning weights and metrics to variables.
Q & A
What is the main topic of the video script?
-The main topic of the video script is explaining the concept of correlation in data science, its importance, and how to interpret it through graphs.
Who is the creator of the channel mentioned in the script?
-The creator of the channel is Jefferson.
What is the purpose of the correlation coefficient in data science?
-The correlation coefficient is used to measure the relationship between two variables, indicating the strength and direction of the correlation.
What does a correlation coefficient value close to 1 or -1 indicate?
-A correlation coefficient value close to 1 indicates a strong positive correlation, while a value close to -1 indicates a strong negative correlation.
What is the significance of a correlation coefficient value of exactly 1 or -1?
-A correlation coefficient of exactly 1 indicates a perfect positive correlation, while a value of exactly -1 indicates a perfect negative correlation.
What does a correlation coefficient value near 0 represent?
-A correlation coefficient value near 0 represents no correlation or a null correlation between the variables.
How can one visualize the correlation between two variables using a scatter plot?
-In a scatter plot, the correlation between two variables can be visualized by observing the direction and slope of the line formed by the plotted points. A positive correlation will have an upward slope, while a negative correlation will have a downward slope.
What is a hit map graph and how is it used in the context of the script?
-A hit map graph is a visual representation that shows the correlation coefficients of variables in a matrix format, with colors indicating the strength of the correlation. It is used to quickly identify strong and weak correlations between variables.
What is the significance of correlation in predictive modeling and machine learning?
-Correlation is significant in predictive modeling and machine learning because it helps algorithms identify which variables are related to each other and should be given more weight in the model's mathematical function.
How does the script suggest to determine if a correlation is strong or weak?
-The script suggests using a scatter plot to visually determine if a correlation is strong or weak, and also mentions that a correlation coefficient above 0.6 is considered strong, above 0.8 is very strong, and at 1 is perfect.
What is the role of the correlation coefficient in exploratory data analysis?
-In exploratory data analysis, the correlation coefficient helps in identifying relationships between variables, which can be crucial for understanding data patterns and making informed decisions in further analysis.
Outlines

Dieser Bereich ist nur für Premium-Benutzer verfügbar. Bitte führen Sie ein Upgrade durch, um auf diesen Abschnitt zuzugreifen.
Upgrade durchführenMindmap

Dieser Bereich ist nur für Premium-Benutzer verfügbar. Bitte führen Sie ein Upgrade durch, um auf diesen Abschnitt zuzugreifen.
Upgrade durchführenKeywords

Dieser Bereich ist nur für Premium-Benutzer verfügbar. Bitte führen Sie ein Upgrade durch, um auf diesen Abschnitt zuzugreifen.
Upgrade durchführenHighlights

Dieser Bereich ist nur für Premium-Benutzer verfügbar. Bitte führen Sie ein Upgrade durch, um auf diesen Abschnitt zuzugreifen.
Upgrade durchführenTranscripts

Dieser Bereich ist nur für Premium-Benutzer verfügbar. Bitte führen Sie ein Upgrade durch, um auf diesen Abschnitt zuzugreifen.
Upgrade durchführenWeitere ähnliche Videos ansehen
Key Machine Learning terminology like Label, Features, Examples, Models, Regression, Classification

Intro to Data Science: Historical Context

S0E1 | Pengantar dunia Data Science, role, dan gajinya
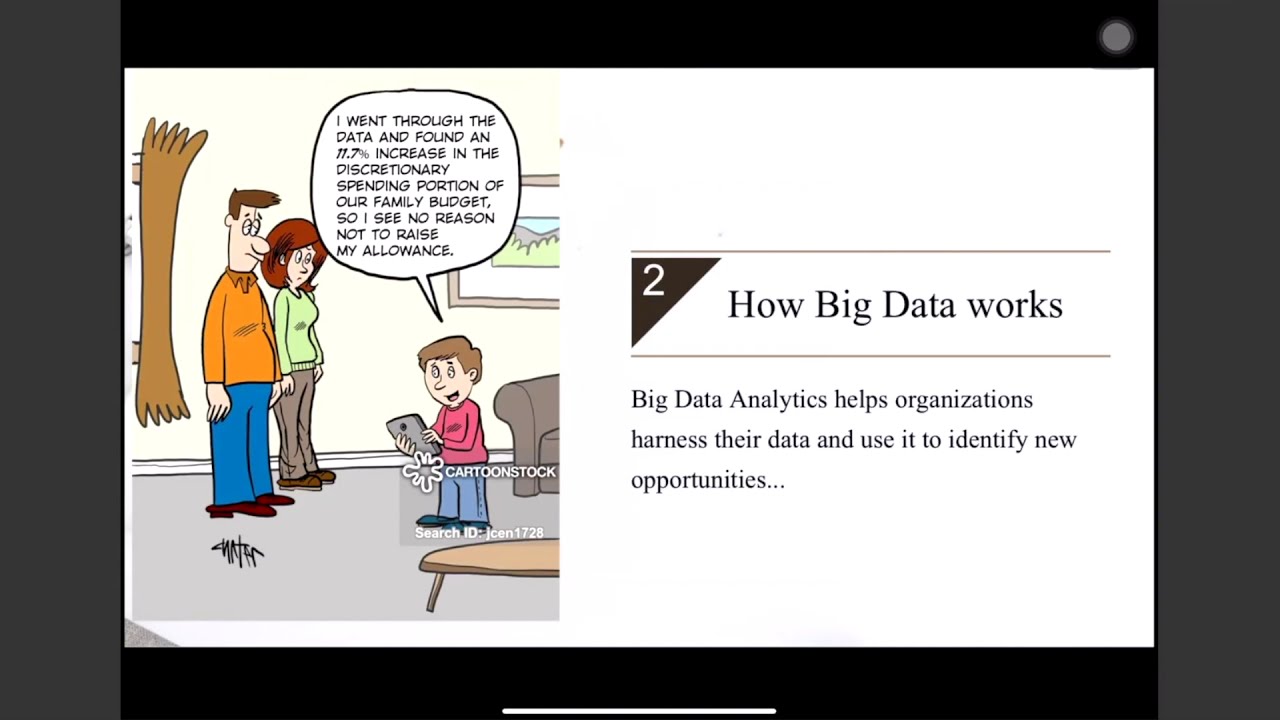
How is Big Data Analytics Used in Business and Accounting?-Summer 2020 Prof. Ruoxin Wu & Tumah Deen

Introduction To Artificial Intelligence | What Is AI?| Artificial Intelligence Tutorial |Simplilearn

Intro to Data Science: What is Data Science?
5.0 / 5 (0 votes)
