A PHASE DIAGRAM OF WATER (H2O) & CARBON DIOXIDE (CO2)
Summary
TLDRThis video explains phase diagrams, focusing on water and carbon dioxide. A phase diagram visually represents the states of a substance (solid, liquid, or gas) at varying temperatures and pressures. The video details key features, including the triple and critical points, for both water and carbon dioxide. Water’s unique behavior at different pressures is explored, such as ice skating, where pressure causes ice to melt. The video also covers carbon dioxide’s sublimation and absence of a liquid phase at 1 atm. The importance of phase diagrams in real-world applications like food preservation and energy production is also highlighted.
Takeaways
- 😀 A phase diagram is a graphical representation showing the states of a substance (solid, liquid, gas) at different temperatures and pressures.
- 😀 Phase boundaries separate different regions in a phase diagram, indicating where two phases coexist in equilibrium.
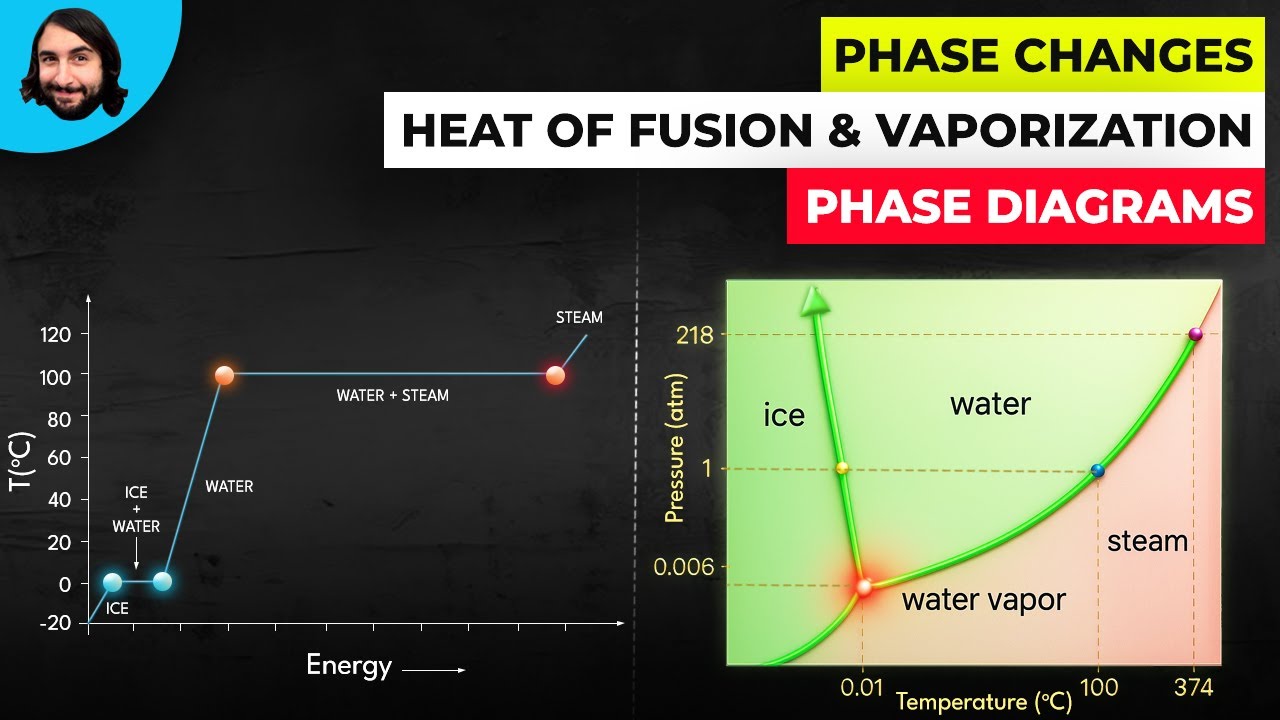
- 😀 Water’s phase diagram includes key features such as its triple point and critical point, which define the conditions where water can exist in multiple states.
- 😀 At its triple point, water exists as a solid, liquid, and gas simultaneously at 0.01°C and 0.6 ATM.
- 😀 Water becomes a supercritical fluid at its critical point, which occurs at 374°C and 218 ATM.
- 😀 Carbon dioxide’s phase diagram behaves differently from water’s, especially in its sublimation process and the absence of a liquid phase at 1 ATM pressure.
- 😀 Carbon dioxide’s triple point is at -56.6°C and 5.11 ATM, where it can exist as a solid, liquid, and gas.
- 😀 At 31.1°C and 73 ATM, carbon dioxide reaches its critical point, becoming a supercritical fluid.
- 😀 Unlike water, carbon dioxide sublimates directly from a solid to a gas at 1 ATM pressure, bypassing the liquid phase.
- 😀 Understanding phase diagrams helps explain real-world phenomena like ice skating and dry ice sublimation, with practical applications in industries like food preservation and energy production.
Q & A
What is a phase diagram?
-A phase diagram is a graphical representation that shows the states (solid, liquid, gas) of a substance at different temperatures and pressures. It helps to understand when and how a substance changes from one phase to another.
What are phase boundaries in a phase diagram?
-Phase boundaries are the lines separating the regions of different phases in a phase diagram. They represent the conditions where two phases coexist in equilibrium.
What is the triple point of water, and why is it significant?
-The triple point of water occurs at 0.01°C and 0.6 ATM, where water can exist as a solid, liquid, and gas simultaneously. It is significant because it represents the unique set of conditions where all three phases of water coexist.
What happens to water at its critical point?
-At its critical point, which occurs at 374°C and 218 ATM, water becomes a supercritical fluid. This state has properties of both a liquid and a gas.
How does the phase diagram of carbon dioxide differ from that of water?
-Carbon dioxide behaves differently under temperature and pressure changes. Unlike water, CO2 sublimates at 1 ATM, going directly from solid to gas. Water has a liquid phase at 1 ATM, whereas CO2 does not.
What is the triple point of carbon dioxide, and how is it different from water's triple point?
-The triple point of carbon dioxide occurs at -56.6°C and 5.11 ATM. At this point, CO2 exists as a solid, liquid, and gas in equilibrium. Unlike water's triple point, CO2's occurs at a much lower temperature and higher pressure.
Why does carbon dioxide not have a liquid phase at 1 ATM pressure?
-At 1 ATM, carbon dioxide sublimates directly from a solid to a gas. It does not have a liquid phase because the conditions necessary for liquid CO2 do not exist at this pressure.
What real-world phenomena are explained by the phase diagram of water?
-The negative slope of water’s phase diagram explains why ice skating works. The pressure of the skate causes the ice to melt underfoot, creating a thin layer of water for smooth gliding.
How does sublimation of carbon dioxide explain the fog produced by dry ice?
-The sublimation of carbon dioxide explains why dry ice creates a fog. CO2 directly transitions from a solid to a gas without becoming a liquid, which forms a visible mist when it contacts the warmer air.
What are some industrial applications of phase diagrams of water and carbon dioxide?
-Phase diagrams are vital in industries like food preservation (using CO2 to keep products fresh) and energy production (using supercritical water in power generation). They help in understanding and utilizing the unique properties of substances under various conditions.
Outlines

Dieser Bereich ist nur für Premium-Benutzer verfügbar. Bitte führen Sie ein Upgrade durch, um auf diesen Abschnitt zuzugreifen.
Upgrade durchführenMindmap

Dieser Bereich ist nur für Premium-Benutzer verfügbar. Bitte führen Sie ein Upgrade durch, um auf diesen Abschnitt zuzugreifen.
Upgrade durchführenKeywords

Dieser Bereich ist nur für Premium-Benutzer verfügbar. Bitte führen Sie ein Upgrade durch, um auf diesen Abschnitt zuzugreifen.
Upgrade durchführenHighlights

Dieser Bereich ist nur für Premium-Benutzer verfügbar. Bitte führen Sie ein Upgrade durch, um auf diesen Abschnitt zuzugreifen.
Upgrade durchführenTranscripts

Dieser Bereich ist nur für Premium-Benutzer verfügbar. Bitte führen Sie ein Upgrade durch, um auf diesen Abschnitt zuzugreifen.
Upgrade durchführenWeitere ähnliche Videos ansehen

Phase diagrams | States of matter and intermolecular forces | Chemistry | Khan Academy
Phase Changes, Heats of Fusion and Vaporization, and Phase Diagrams

Lecture 21 Ternary Phase Diagrams

Science 9: Cellular respiration and its difference from Photosynthesis (Tagalog-English Format)

Phase Diagrams | Phase Diagram of Water and Phase Diagram of Carbon Dioxide

INTRODUÇÃO À QUÍMICA AQUÁTICA (mini-aula)
5.0 / 5 (0 votes)
