Teori Regresi Linier Sederhana (Part 3/selesai) - Statistika Parametrik
Summary
TLDRThe video explains statistical methods used to assess the accuracy of a regression model predicting sales based on promotion costs. It covers the F-test to determine model goodness-of-fit, with an emphasis on comparing F-count to F-table values to decide if the model is valid. The t-test is also discussed to check the linear relationship between promotion and sales. Using both manual calculations and SPSS, the presenter concludes that a positive linear relationship exists, suggesting increased advertising costs can boost sales. The overall message emphasizes the value of statistics in decision-making.
Takeaways
- 😀 The F-test is used to assess the accuracy of a regression model by comparing predicted and actual values.
- 😀 If F count is greater than F table, the model is considered good, meaning it accurately predicts the dependent variable.
- 😀 If F count is less than or equal to F table, the model is considered bad, indicating a poor fit between prediction and observation.
- 😀 The degrees of freedom (df) in the F-test are calculated based on the number of independent and dependent variables.
- 😀 Excel can be used to easily compute F-test values and compare them to the F-table for decision-making.
- 😀 A value greater than the critical F value (from the F-table) indicates a strong model with a good fit at a 90% confidence level.
- 😀 The t-test is used to determine if there is a significant linear relationship between the independent and dependent variables.
- 😀 If the t-statistic exceeds the critical value from the t-table, the null hypothesis (no relationship) is rejected, confirming a significant relationship.
- 😀 The two-sided t-test uses an alpha of 0.05, and a calculated t-value greater than the critical t-value leads to rejecting the null hypothesis.
- 😀 SPSS can be used to speed up hypothesis testing by automating the calculation of t-values and F-values.
- 😀 The final conclusion from the analysis suggests that increasing promotion or advertising costs is likely to boost sales, based on the statistical findings.
Q & A
What is the purpose of using the F-test in regression analysis?
-The F-test is used to test the accuracy of the regression model and determine if the predicted values can effectively describe or predict the actual conditions. It helps assess the goodness-of-fit of the model.
How does the F-test help in deciding if a regression model is good?
-If the F-count is greater than the F-table value, the model is considered a good fit, meaning it can accurately predict the dependent variable. If the F-count is less than or equal to the F-table, the model is considered a bad fit.
What do the degrees of freedom (df1 and df2) represent in the F-test?
-In the F-test, df1 represents the number of independent variables minus one (k-1), and df2 represents the number of observations minus the number of independent variables (n-k). These values are used to calculate the F-table value.
What does the term 'goodness-of-fit' mean in regression analysis?
-Goodness-of-fit refers to how well the regression model predicts the dependent variable based on the independent variables. A good model will show a significant relationship between variables, as confirmed by the F-test and t-test.
How is the t-test used to examine the relationship between promotion costs and sales?
-The t-test is used to determine if there is a real linear relationship between promotion costs (independent variable) and sales (dependent variable). It tests whether the relationship is statistically significant by comparing the t-count with the t-table value.
What does it mean if the t-count is greater than the t-table value in the t-test?
-If the t-count is greater than the t-table value, it indicates that the null hypothesis (H0) is rejected, meaning there is a statistically significant linear relationship between promotion costs and sales.
What role does the p-value play in the t-test decision?
-The p-value is compared with the alpha level (e.g., 0.05) to determine the significance of the result. If the p-value is smaller than alpha, the null hypothesis is rejected, indicating that the relationship between the variables is significant.
Why is it important to use both manual calculations and software tools like SPSS for regression analysis?
-Using both manual calculations and software tools like SPSS provides a more thorough understanding of the process. While manual calculations ensure accuracy and comprehension of statistical formulas, SPSS makes the process faster and more efficient, especially for large datasets.
What is the recommended conclusion based on the statistical tests in the script?
-The conclusion is that promotion costs have a positive influence on sales volume. Therefore, increasing promotion or advertising costs can lead to an increase in sales.
What is the significance of the 90% confidence level mentioned in the F-test conclusion?
-The 90% confidence level indicates that there is a 90% probability that the regression model accurately predicts the relationship between promotion costs and sales. It means the results can be trusted with a high level of confidence.
Outlines

Dieser Bereich ist nur für Premium-Benutzer verfügbar. Bitte führen Sie ein Upgrade durch, um auf diesen Abschnitt zuzugreifen.
Upgrade durchführenMindmap

Dieser Bereich ist nur für Premium-Benutzer verfügbar. Bitte führen Sie ein Upgrade durch, um auf diesen Abschnitt zuzugreifen.
Upgrade durchführenKeywords

Dieser Bereich ist nur für Premium-Benutzer verfügbar. Bitte führen Sie ein Upgrade durch, um auf diesen Abschnitt zuzugreifen.
Upgrade durchführenHighlights

Dieser Bereich ist nur für Premium-Benutzer verfügbar. Bitte führen Sie ein Upgrade durch, um auf diesen Abschnitt zuzugreifen.
Upgrade durchführenTranscripts

Dieser Bereich ist nur für Premium-Benutzer verfügbar. Bitte führen Sie ein Upgrade durch, um auf diesen Abschnitt zuzugreifen.
Upgrade durchführenWeitere ähnliche Videos ansehen

PERBEDAAN UJI REGRESI LOGISTIK DAN UJI REGRESI LINEAR | PENJELASAN MUDAH DIPAHAMI MAHASISWA

Teori Regresi Linier Sederhana (Part 1) - Statistika Parametrik
Tutorial Analisis Regresi Tunggal dengan JASP

Regresi Linear Sederhana dengan Ordinary Least Square
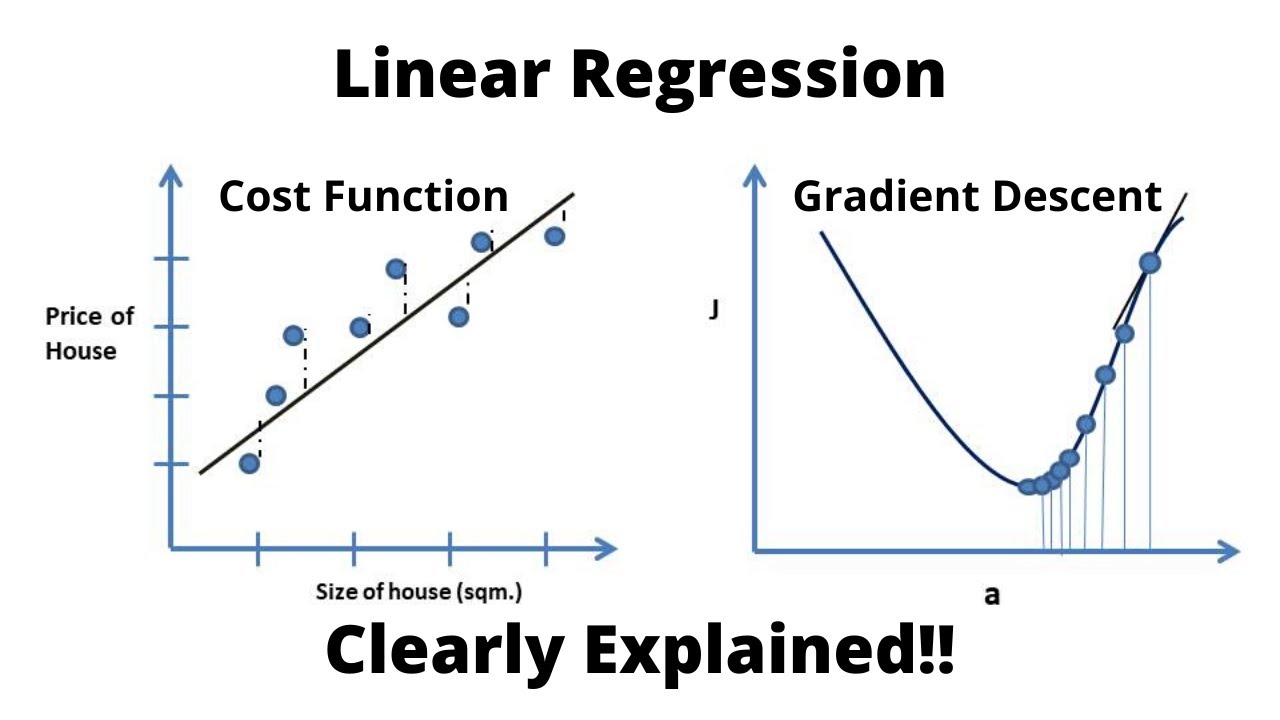
Linear Regression, Cost Function and Gradient Descent Algorithm..Clearly Explained !!

Uji Regresi Linier Sederhana Dengan SPSS | Pembahasan Lengkap!
5.0 / 5 (0 votes)
