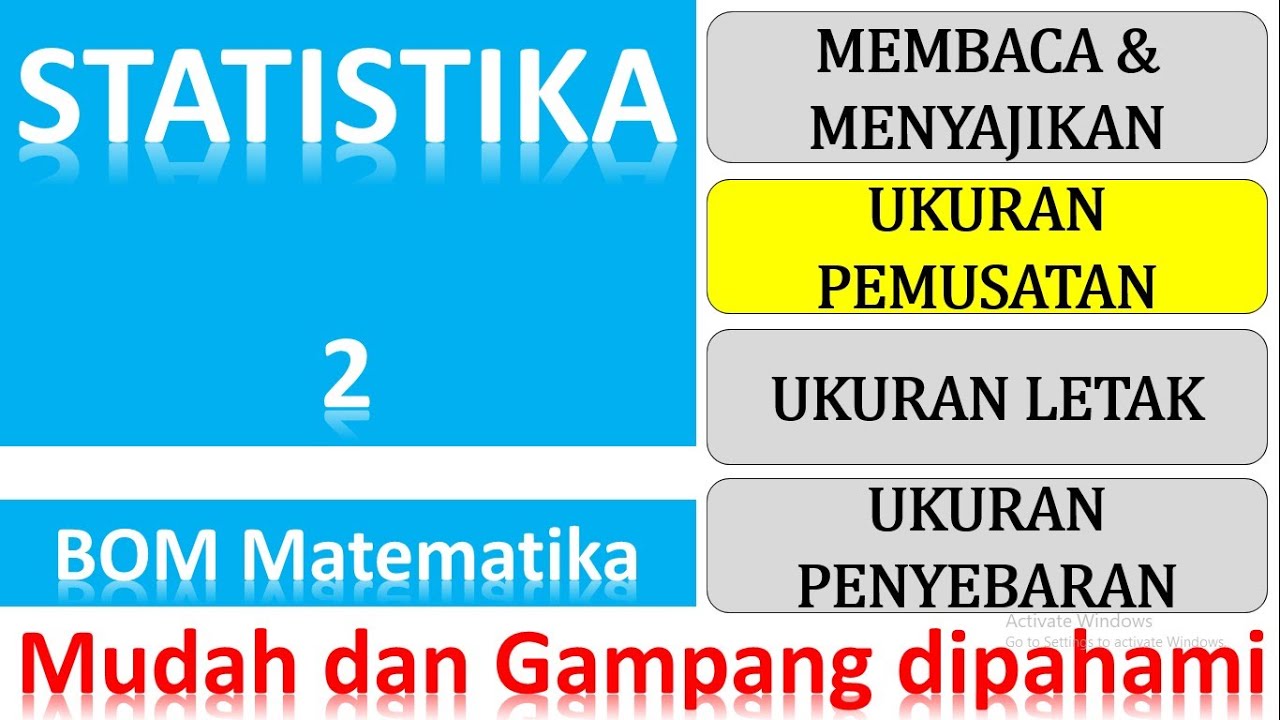
STATISTIKA PART 4 (MEAN, MEDIAN, MODUS)
Summary
TLDRThis educational video covers the topic of measures of central tendency in statistics, explaining three key concepts: mean, median, and mode. The script starts by explaining the formula for calculating the mean for both individual and grouped data, providing examples. It then dives into the calculation of the median for both types of data, detailing specific formulas for even and odd datasets. Finally, the video concludes by explaining how to calculate the mode, both for individual and grouped data, with clear examples and explanations, making the content accessible for students looking to understand data analysis techniques.
Takeaways
- 😀 The script explains the concept of data centralization, focusing on three measures: mean, median, and mode.
- 😀 The mean (average) is calculated by summing all data points and dividing by the total number of data points.
- 😀 A practical example for calculating the mean using data (4, 5, 6, 7, 8, 10, 10, 10) demonstrates how the formula X̄ = Σxi/n is applied.
- 😀 For grouped data, the mean formula becomes X̄ = Σ(fx) / Σf, where 'f' represents frequency and 'x' represents the midpoint of each class.
- 😀 The median (Q2) represents the middle value in a sorted dataset, with different formulas for even and odd numbers of data points.
- 😀 An example of calculating the median of the set (4, 5, 6, 7, 8, 10, 10, 10) shows how to find the middle values and calculate the median as 7.5.
- 😀 When calculating the median for grouped data, a formula involving class boundaries, frequencies, and class width is used, including interpolation if necessary.
- 😀 The script also covers the process of finding the median for grouped data using the formula MS = L2 + (½n - Σf2) / f2 * C.
- 😀 Mode represents the most frequently occurring value in a dataset, and for grouped data, it is calculated using a formula involving the differences in frequencies of adjacent classes.
- 😀 A practical example demonstrates the calculation of the mode for grouped data using the formula: l + (d1 / (d1 + d2)) * C, with necessary steps for each part of the formula.
- 😀 The script concludes with a reminder that understanding how to calculate and apply mean, median, and mode is key for analyzing data effectively.
Q & A
What are the three main measures of central tendency discussed in the video?
-The three main measures of central tendency discussed in the video are the mean (rataan), median (Q2), and mode.
How is the mean (rataan) calculated for individual data?
-For individual data, the mean is calculated using the formula: X̄ = Σxi / n, where Σxi is the sum of all data points, and n is the total number of data points.
What is the formula for calculating the mean of grouped data?
-The formula for calculating the mean of grouped data is: X̄ = Σ(fx) / Σf, where fx is the product of the frequency and the midpoint (x) of each class, and Σf is the total frequency.
What is the process for calculating the mean from the following data: 4, 5, 6, 7, 8, 10, 10, 10?
-To calculate the mean, first add all the data values: 4 + 5 + 6 + 7 + 8 + 10 + 10 + 10 = 60. Then divide by the total number of data points (8): 60 / 8 = 7.5.
How is the median (Q2) calculated for a set of data?
-For a set of data, if the data is ordered, the median is the middle value. For an even number of data points, it is the average of the two middle values.
What is the formula for finding the median of grouped data?
-For grouped data, the formula is: MS = L2 + (½ n - ΣF2) / F2 * C, where L2 is the lower boundary of the median class, ΣF2 is the cumulative frequency before the median class, F2 is the frequency of the median class, and C is the class width.
How do you find the median for the following ordered data: 4, 5, 6, 7, 8, 10, 10, 10?
-To find the median, divide the data into two halves. For 8 data points, the 4th and 5th values are 7 and 8. The median is the average: (7 + 8) / 2 = 7.5.
What does 'mode' refer to in statistics?
-The mode is the value that appears most frequently in a data set.
How is the mode calculated for grouped data?
-For grouped data, the mode is calculated using the formula: L + (D1 / (D1 + D2)) * C, where L is the lower boundary of the modal class, D1 is the difference between the modal class frequency and the previous class, D2 is the difference between the modal class frequency and the next class, and C is the class width.
What is the mode of the following data set: 4, 5, 6, 7, 8, 10, 10, 10?
-The mode is 10, as it is the value that appears most frequently in the data set.
Outlines

Dieser Bereich ist nur für Premium-Benutzer verfügbar. Bitte führen Sie ein Upgrade durch, um auf diesen Abschnitt zuzugreifen.
Upgrade durchführenMindmap

Dieser Bereich ist nur für Premium-Benutzer verfügbar. Bitte führen Sie ein Upgrade durch, um auf diesen Abschnitt zuzugreifen.
Upgrade durchführenKeywords

Dieser Bereich ist nur für Premium-Benutzer verfügbar. Bitte führen Sie ein Upgrade durch, um auf diesen Abschnitt zuzugreifen.
Upgrade durchführenHighlights

Dieser Bereich ist nur für Premium-Benutzer verfügbar. Bitte führen Sie ein Upgrade durch, um auf diesen Abschnitt zuzugreifen.
Upgrade durchführenTranscripts

Dieser Bereich ist nur für Premium-Benutzer verfügbar. Bitte führen Sie ein Upgrade durch, um auf diesen Abschnitt zuzugreifen.
Upgrade durchführenWeitere ähnliche Videos ansehen
Ukuran pemusatan data, mean median modus, Statistika

Tendensi Sentral: Mean, Median, Modus

Statistika Dasar Ukuran Pemusatan Data (Mean, Modus, Median) Data Tunggal dan Data Kelompok

Statistika 1 ~ Ukuran Pemusatan Data (Mean/Rata-Rata, Median, Modus) ~ Materi PJJ Kelas VIII / 8 SMP

Statistics: The average | Descriptive statistics | Probability and Statistics | Khan Academy
2.5 Medidas descriptivas
5.0 / 5 (0 votes)
