Peluang Distribusi NORMAL beserta Contoh Soal Pembahasan
Summary
TLDRThis video explains the concept of continuous probability distributions, with a focus on the normal distribution, which is commonly used in statistics. It covers key elements such as the bell-shaped curve, mean, and standard deviation. The video also dives into how to calculate probabilities using the normal distribution and how to read statistical tables. Real-life examples are given, including how this distribution applies to various fields like meteorology and industry. The presenter also provides a detailed explanation of the Z-score and its transformation to the standard normal distribution.
Takeaways
- 😀 Continuous probability distribution is an essential concept in statistics, used to model phenomena in various fields like science, industry, and research.
- 😀 The normal distribution is the most well-known type of continuous probability distribution, often represented by a bell-shaped curve.
- 😀 The graph of a normal distribution curve is symmetric and centered around the mean (μ), with the standard deviation (σ) determining its spread.
- 😀 Standard deviation (σ) is a key measure in statistics that indicates the extent of spread of data points from the mean.
- 😀 The normal distribution is widely applicable, and many natural, industrial, and economic processes are modeled using it, such as rainfall, income levels, and error distributions.
- 😀 The normal distribution is also referred to as the Gaussian distribution, named after Carl Friedrich Gauss, who contributed to its formulation.
- 😀 To compute probabilities for normal distribution, statistical tables (Z-tables) are often used, and they provide the cumulative probability for different Z-scores.
- 😀 Z-scores are used to standardize normal distributions, allowing for comparisons across different datasets with varying means and standard deviations.
- 😀 The transformation from a general normal distribution to a standard normal distribution involves converting data into Z-scores, with a mean of 0 and a standard deviation of 1.
- 😀 The cumulative area under the normal curve represents the probability of a data point falling within a certain range, which can be calculated using integral formulas or Z-tables.
- 😀 Practical examples, such as predicting the lifespan of light bulbs based on their normal distribution, help apply theoretical concepts to real-world situations.
Q & A
What is a normal distribution?
-A normal distribution is a type of probability distribution that is symmetric about the mean. Its graph forms a bell curve, which is widely used in statistics to model many natural phenomena, such as height, weight, and measurement errors.
What does the graph of a normal distribution look like?
-The graph of a normal distribution looks like a bell curve, with the highest point at the mean (average) value. It is symmetrical, and the tails of the curve approach, but never touch, the horizontal axis.
What is the mean (μ) in a normal distribution?
-The mean (μ) in a normal distribution represents the average value of the data and is located at the center of the bell curve. It is the point around which the data is symmetrically distributed.
What is the standard deviation (σ) in a normal distribution?
-The standard deviation (σ) in a normal distribution measures the spread or dispersion of the data around the mean. A larger standard deviation means the data is more spread out, while a smaller standard deviation indicates that the data is clustered closer to the mean.
How is the normal distribution used in real-world applications?
-Normal distribution is widely used in various fields, including meteorology, economics, quality control in manufacturing, and even in predicting the likelihood of events such as the distribution of heights in a population or the performance of machinery.
What is the formula for the normal distribution?
-The formula for the normal distribution is: P(X) = (1 / (σ√(2π))) * e^(-(X - μ)² / 2σ²), where X is the value, μ is the mean, and σ is the standard deviation. This formula describes the probability density function of the normal distribution.
What is a standard normal distribution?
-A standard normal distribution is a normal distribution with a mean of 0 and a standard deviation of 1. It is used to simplify calculations and is represented by the z-score, which standardizes data points from any normal distribution.
What is a z-score, and how is it used?
-A z-score is a statistical measurement that describes a value's relation to the mean of a group of values, expressed as the number of standard deviations it is away from the mean. It is used to transform a normal distribution into a standard normal distribution, making it easier to compare values across different normal distributions.
What is the role of a probability table in normal distribution?
-A probability table, often called a z-table, is used to find the area under the normal distribution curve for given values of z-scores. It helps in calculating probabilities and understanding how likely certain outcomes are within a normal distribution.
How do you calculate probabilities using a z-table?
-To calculate probabilities using a z-table, you first convert the raw score (X) into a z-score using the formula z = (X - μ) / σ. Then, you look up the z-score in the z-table to find the corresponding probability, which represents the area under the curve to the left of that z-score.
Outlines

Dieser Bereich ist nur für Premium-Benutzer verfügbar. Bitte führen Sie ein Upgrade durch, um auf diesen Abschnitt zuzugreifen.
Upgrade durchführenMindmap

Dieser Bereich ist nur für Premium-Benutzer verfügbar. Bitte führen Sie ein Upgrade durch, um auf diesen Abschnitt zuzugreifen.
Upgrade durchführenKeywords

Dieser Bereich ist nur für Premium-Benutzer verfügbar. Bitte führen Sie ein Upgrade durch, um auf diesen Abschnitt zuzugreifen.
Upgrade durchführenHighlights

Dieser Bereich ist nur für Premium-Benutzer verfügbar. Bitte führen Sie ein Upgrade durch, um auf diesen Abschnitt zuzugreifen.
Upgrade durchführenTranscripts

Dieser Bereich ist nur für Premium-Benutzer verfügbar. Bitte führen Sie ein Upgrade durch, um auf diesen Abschnitt zuzugreifen.
Upgrade durchführenWeitere ähnliche Videos ansehen
Types Of Distribution In Statistics | Probability Distribution Explained | Statistics | Simplilearn

Modul 1.1 - MATERI MODUL 1 DISTRIBUSI PELUANG
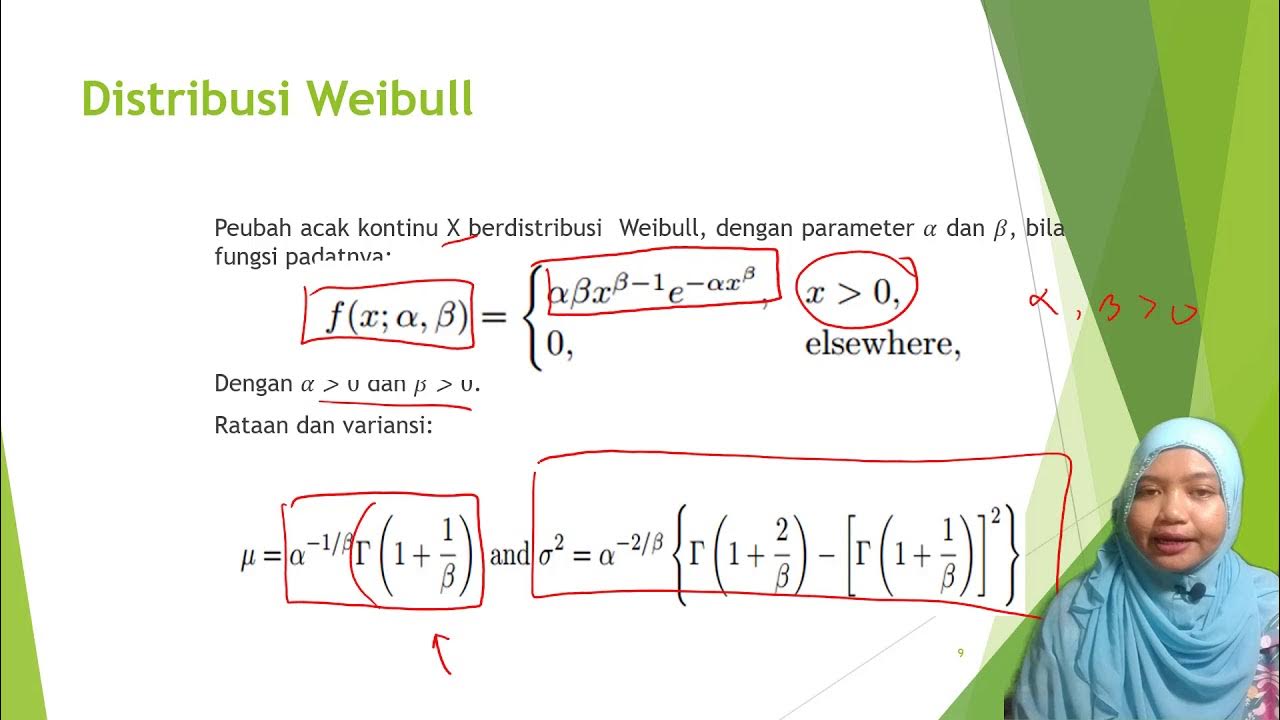
Distribusi Chi-square, Weibull, t dan F
Distribusi Normal • Part 1: Distribusi Peluang Variabel Acak Kontinu
Sample and Population in Statistics | Statistics Tutorial | MarinStatsLectures

Metode Statistika | Sebaran Peluang Kontinu | Mengenal Sebaran Normal
5.0 / 5 (0 votes)
