一夜。統計學:相關分析
Summary
TLDRThis script introduces students to the statistical technique of correlation analysis, which is used to interpret the relationships between variables and to check for multicollinearity. It emphasizes the simplicity of correlation analysis and its role as a preliminary step before regression analysis in social science research. The script demonstrates how to perform correlation analysis using SPSS software, focusing on the relationship between three variables: corporate reputation, continuous commitment, and turnover intention. It explains the symmetrical nature of the correlation matrix and the significance of the diagonal elements being 1, representing perfect correlation with oneself. The summary of the correlation coefficients is suggested as a concise way to present the results, which is fundamental for further regression analysis and hypothesis testing.
Takeaways
- 📊 **Correlation Analysis Introduction**: The speaker introduces the concept of correlation analysis as a statistical technique to understand the relationship between variables.
- 🔍 **Understanding Variables**: Correlation analysis helps to determine if there is an association between variables before proceeding to regression analysis.
- 🔗 **Causality and Correlation**: In social science research, correlation analysis is used to preliminarily understand if there's a potential causal relationship between variables.
- 📈 **SPSS Software Utilization**: The script demonstrates the ease of performing correlation analysis using the SPSS statistical software.
- 📋 **Selecting Variables**: The example given involves analyzing the relationship between 'corporate reputation', 'continuous commitment', and 'job retention intention'.
- 🔢 **Correlation Coefficient**: The correlation coefficient table is symmetrical, with the diagonal elements representing the correlation of a variable with itself (always 1).
- 🤝 **Bivariate Correlation**: The 'bivariate' option in SPSS is used to calculate the correlation between two variables, but it can also handle more than two variables.
- ⚖️ **Symmetry in Correlation**: The correlation between two variables is reciprocal, meaning the correlation of A with B is the same as B with A.
- ✅ **Operation Simplicity**: Performing a correlation analysis in SPSS is straightforward, with minimal settings required.
- 📝 **Report Interpretation**: The output report from the correlation analysis provides a clear view of the relationship between selected variables.
- 📉 **Practical Application**: Correlation analysis serves as a foundation for further regression analysis and hypothesis testing in research.
Q & A
What is the purpose of correlation analysis?
-Correlation analysis is used to explain the association between variables and to understand if they have collinearity, which is essential before conducting regression analysis for further hypothesis testing.
Why is it important to check for collinearity among variables before regression analysis?
-Checking for collinearity is important because it can affect the stability and interpretability of regression coefficients, and it helps in identifying if the variables are suitable for further causal analysis.
What does the script suggest about the complexity of correlation analysis in mathematical terms?
-The script implies that while correlation analysis might seem complex mathematically, it is straightforward to perform using statistical software like SPSS.
How is correlation analysis conducted in SPSS according to the script?
-In SPSS, correlation analysis is conducted by selecting 'Analyze' from the menu, choosing 'Correlate', and then selecting 'Bivariate' to perform the analysis on the chosen variables.
What variables are used as an example in the script for demonstrating correlation analysis?
-The example in the script uses 'corporate reputation', 'continuous commitment', and 'job retention intention' as the variables for demonstrating the correlation analysis.
What does the script suggest about the diagonal values in a correlation matrix?
-The script explains that the diagonal values in a correlation matrix are always 1, representing the perfect correlation of a variable with itself.
Why are the values in the correlation matrix symmetrical around the diagonal?
-The values are symmetrical around the diagonal because the correlation between two variables is a mutual relationship, meaning the correlation of variable A with B is the same as B with A.
What is the correlation coefficient between 'corporate reputation' and 'continuous commitment' as per the script?
-According to the script, the correlation coefficient between 'corporate reputation' and 'continuous commitment' is 0.125.
How can the correlation matrix be simplified for reporting purposes in academic papers?
-The script suggests that for reporting in academic papers, one can simplify the correlation matrix by only including the left half or the right half, as they are symmetrical and provide the same information.
What is the primary reason for conducting correlation analysis before hypothesis testing in social science research?
-The primary reason is to preliminarily understand if there is a significant association between the variables, which is a prerequisite for further testing of causal relationships in social science research.
Outlines

Dieser Bereich ist nur für Premium-Benutzer verfügbar. Bitte führen Sie ein Upgrade durch, um auf diesen Abschnitt zuzugreifen.
Upgrade durchführenMindmap

Dieser Bereich ist nur für Premium-Benutzer verfügbar. Bitte führen Sie ein Upgrade durch, um auf diesen Abschnitt zuzugreifen.
Upgrade durchführenKeywords

Dieser Bereich ist nur für Premium-Benutzer verfügbar. Bitte führen Sie ein Upgrade durch, um auf diesen Abschnitt zuzugreifen.
Upgrade durchführenHighlights

Dieser Bereich ist nur für Premium-Benutzer verfügbar. Bitte führen Sie ein Upgrade durch, um auf diesen Abschnitt zuzugreifen.
Upgrade durchführenTranscripts

Dieser Bereich ist nur für Premium-Benutzer verfügbar. Bitte führen Sie ein Upgrade durch, um auf diesen Abschnitt zuzugreifen.
Upgrade durchführenWeitere ähnliche Videos ansehen
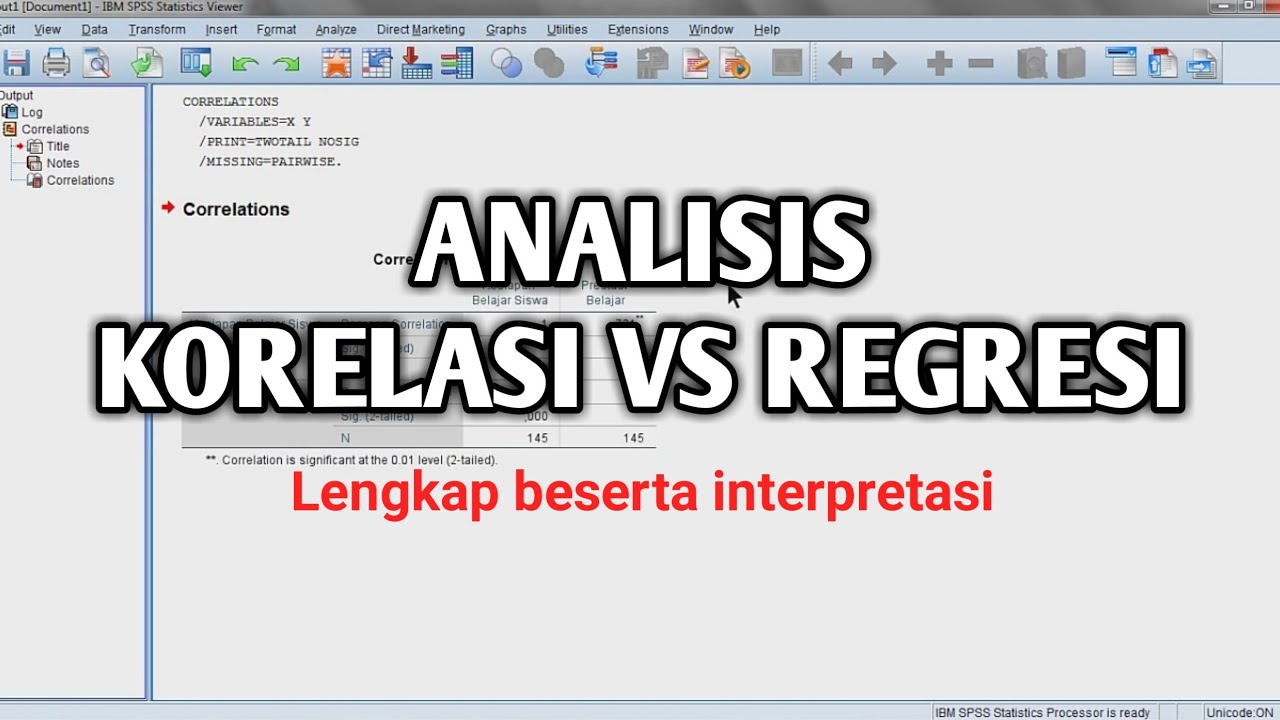
SPSS LENGKAP!! Perbedaan Analisis Korelasi dengan Analisis Regresi
Korelasi Product Moment (r) Hal 110-116 Bab 3 STATISTIK Kelas 11 SMA Kurikulum Merdeka
CORRELATION || MATHEMATICS IN THE MODERN WORLD
Correlation Analysis - Full Course in 30 min
Pengantar Analisis Regresi dalam Bidang Psikologi dan Ilmu Sosial

Test of Correlation using JAMOVI
5.0 / 5 (0 votes)
