STATISTIKA - Uji T Sampel Bebas (Independent Samples T Test) Perhitungan Manual
Summary
TLDRThis video script provides a comprehensive guide to conducting an independent sample t-test, focusing on comparing the mean scores of two groups. It begins by explaining the hypothesis formulation, then walks through a practical example using statistics exam scores from two classes (PGMI class 4E and 4B). The speaker demonstrates how to calculate the t-statistic manually, using data from both groups, and compares the results to a t-table to determine if there is a significant difference between the groups. The tutorial is detailed, ensuring viewers understand both the theory and application of the t-test.
Takeaways
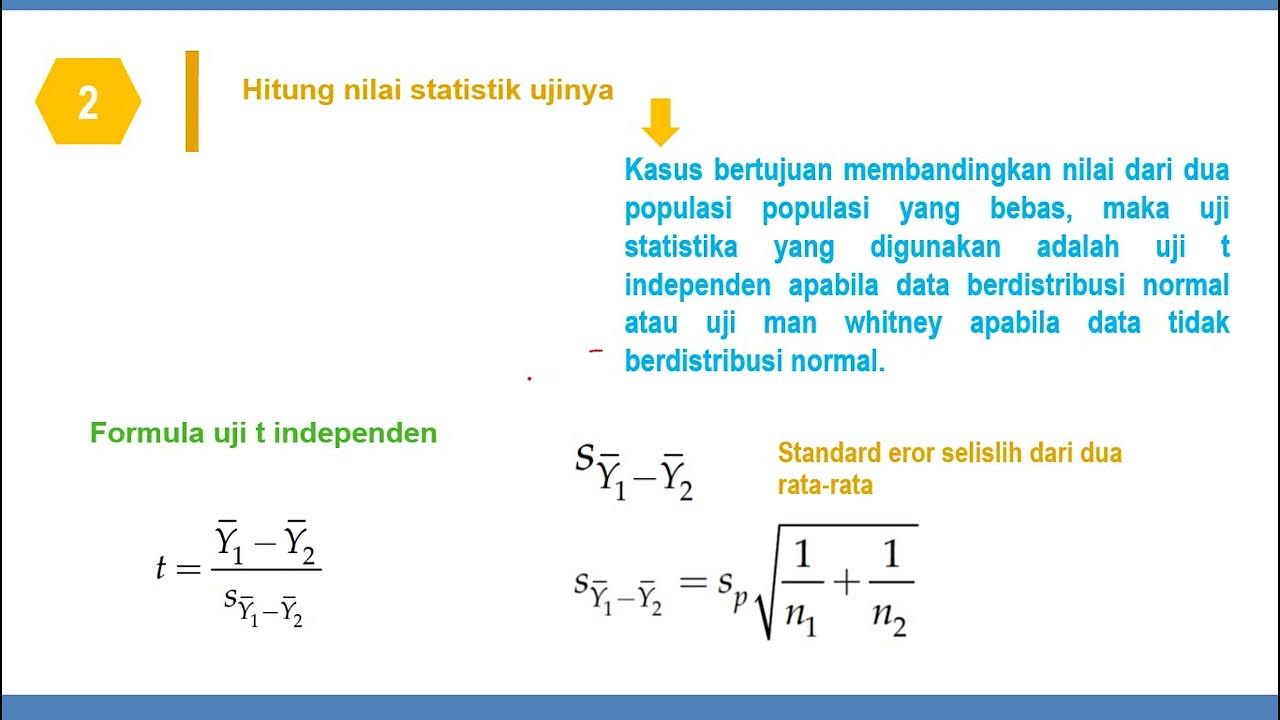
- 😀 The Independent Sample t-test is used to compare the means of two independent groups to determine if there is a significant difference between them.
- 😀 The null hypothesis (H₀) states that there is no difference in the means of the two groups being compared.
- 😀 The alternative hypothesis (H₁) asserts that there is a significant difference between the two groups' means.
- 😀 An example is provided, comparing the exam scores of two PGMI classes (4E and 4B) with a sample size of 15 students per class.
- 😀 The significance level (α) is set at 0.05, and the confidence level is 95%.
- 😀 The steps in the hypothesis testing process include formulating the hypotheses, calculating sample means and variances, and determining the t-statistic.
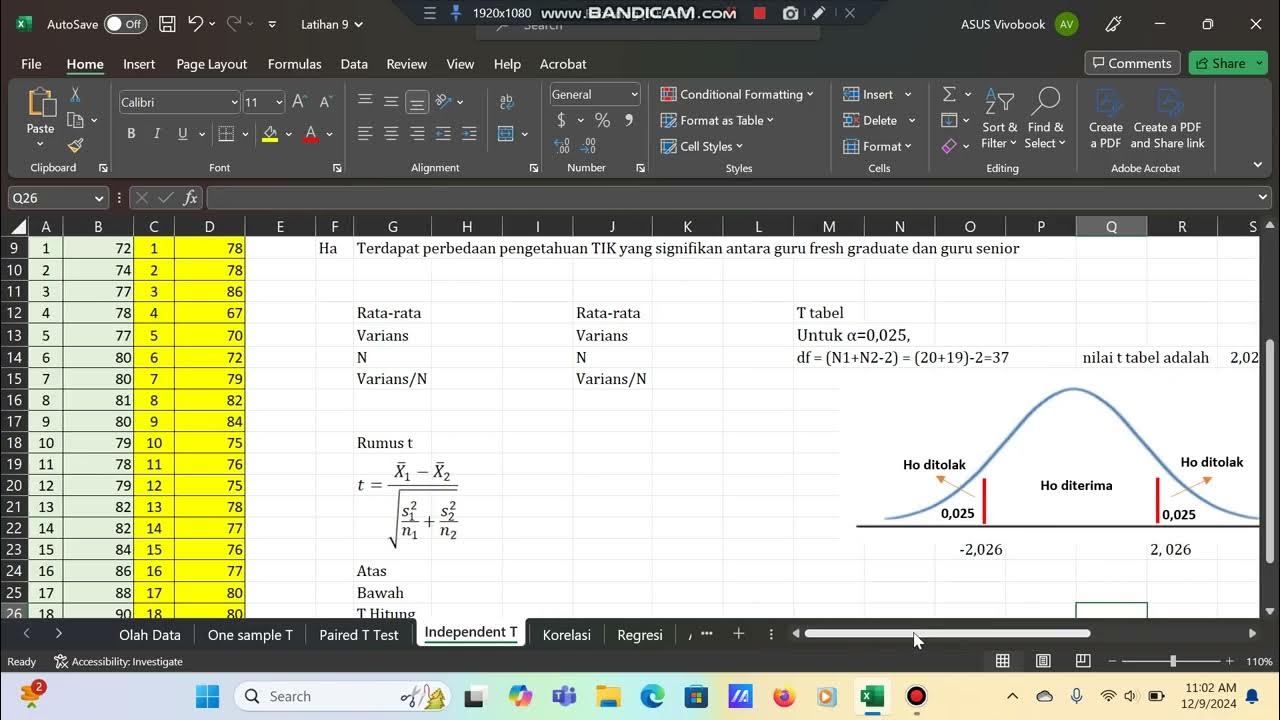
- 😀 The t-statistic is calculated using the formula: t = (X₁ - X₂) / sqrt((S₁²/n₁) + (S₂²/n₂)).
- 😀 After calculating the t-statistic, it is compared to the t-table value (critical value) to decide whether to reject or fail to reject the null hypothesis.
- 😀 In the example, the calculated t-statistic was 1.41, and the t-table value was 2.048, leading to the failure to reject the null hypothesis.
- 😀 Since the t-statistic was less than the t-table value, the conclusion was that there is no significant difference in the exam scores between the two classes.
- 😀 The process demonstrates both manual calculations and an explanation of how statistical software (like SPSS) can be used for these tests.
Q & A
What is an independent sample t-test?
-An independent sample t-test is a statistical test used to compare the means of two independent groups to determine if there is a significant difference between them.
What are the key assumptions of an independent sample t-test?
-The assumptions of an independent sample t-test include the independence of the samples, normal distribution of the data in each group, and similar variances (homogeneity of variance) between the two groups.
What is the purpose of the null hypothesis (H₀) in this test?
-The null hypothesis (H₀) in an independent sample t-test suggests that there is no significant difference between the two groups' means, indicating that any observed differences are due to random chance.
What is the alternative hypothesis (H₁) in this test?
-The alternative hypothesis (H₁) in an independent sample t-test posits that there is a significant difference between the means of the two groups.
How is the t-value calculated in an independent sample t-test?
-The t-value is calculated using the formula: t = (X̄1 - X̄2) / √[(S1²/n1) + (S2²/n2)], where X̄1 and X̄2 are the means of the two groups, S1² and S2² are the variances, and n1 and n2 are the sample sizes of the two groups.
What does the degrees of freedom (df) refer to in the t-test?
-Degrees of freedom (df) refers to the total number of observations in both groups minus 2 (df = n1 + n2 - 2). It is used to determine the critical value from the t-distribution table.
What is the significance of the t-table in hypothesis testing?
-The t-table provides critical values of t for different degrees of freedom and significance levels. These values are used to compare against the calculated t-value to determine whether the null hypothesis should be rejected.
How do you interpret the results of an independent sample t-test?
-If the calculated t-value is greater than the t-table value, the null hypothesis is rejected, indicating a significant difference between the groups. If the calculated t-value is less than or equal to the t-table value, the null hypothesis is not rejected, indicating no significant difference.
What role do the variances play in the t-test calculation?
-Variances measure the spread or variability of data in each group. They are used in the t-test formula to determine the standard error of the difference between the group means, affecting the calculation of the t-value.
In the example given, what conclusion was drawn from the t-test calculation?
-In the example, the calculated t-value (1.41) was less than the t-table value (2.048), so the null hypothesis (H₀) was accepted, meaning there was no significant difference in the exam scores between class 4E and class 4B.
Outlines

Dieser Bereich ist nur für Premium-Benutzer verfügbar. Bitte führen Sie ein Upgrade durch, um auf diesen Abschnitt zuzugreifen.
Upgrade durchführenMindmap

Dieser Bereich ist nur für Premium-Benutzer verfügbar. Bitte führen Sie ein Upgrade durch, um auf diesen Abschnitt zuzugreifen.
Upgrade durchführenKeywords

Dieser Bereich ist nur für Premium-Benutzer verfügbar. Bitte führen Sie ein Upgrade durch, um auf diesen Abschnitt zuzugreifen.
Upgrade durchführenHighlights

Dieser Bereich ist nur für Premium-Benutzer verfügbar. Bitte führen Sie ein Upgrade durch, um auf diesen Abschnitt zuzugreifen.
Upgrade durchführenTranscripts

Dieser Bereich ist nur für Premium-Benutzer verfügbar. Bitte führen Sie ein Upgrade durch, um auf diesen Abschnitt zuzugreifen.
Upgrade durchführenWeitere ähnliche Videos ansehen

Independent-samples t-test in SPSS

SIMULASI UJI T EFEKTIF DAN CEPAT MELALUI SPSS_BELAJAR STATISTIKA

KULIAH STATISTIK - ANALISIS T-TEST

independen t test menggunakan SPSS

Independent samples t-test secara manual dengan bantuan Ms. Excel

Hypothesis Testing - Difference of Two Means - Student's -Distribution & Normal Distribution
5.0 / 5 (0 votes)
