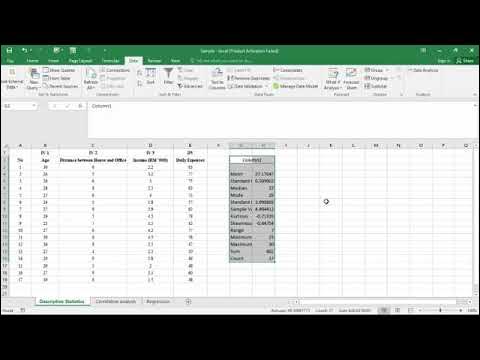
How To Perform A Pearson Correlation Test In Excel
Summary
TLDRIn this tutorial, the process of conducting a Pearson correlation test in Microsoft Excel is explained step by step. The presenter uses an example dataset involving participant ages and BMI to demonstrate the calculation of the Pearson correlation coefficient. The tutorial covers how to calculate the correlation coefficient, the number of data pairs, the t-statistic, degrees of freedom, and the p-value, helping users understand how to assess the strength and significance of the relationship between two continuous variables using Excel. The video offers clear instructions for performing the test and interpreting the results.
Takeaways
- 😀 The video explains how to perform a Pearson correlation test in Microsoft Excel.
- 😀 The data in the example includes two continuous variables: participant ages and BMI.
- 😀 To calculate the Pearson correlation coefficient, use the formula =PEARSON(range1, range2).
- 😀 The correlation coefficient value ranges from -1 (perfect negative correlation) to +1 (perfect positive correlation), with 0 indicating no correlation.
- 😀 A correlation coefficient of 0.76 suggests a strong positive correlation between age and BMI in this example.
- 😀 To calculate the p-value, you first need the number of data pairs (n), which can be found using the COUNT function.
- 😀 The formula for the t-statistic is: t = (r * sqrt(n-2)) / sqrt(1 - r^2).
- 😀 The degrees of freedom (df) is calculated as n - 2, where n is the number of observations.
- 😀 To find the p-value, use the T.DIST.2T function, with the t-statistic, degrees of freedom, and tails (usually 2 for a two-tailed test).
- 😀 A p-value of 0.0064 indicates statistical significance, suggesting that the correlation is unlikely to be due to random chance.
- 😀 The tutorial provides a detailed step-by-step guide on using Excel functions to perform correlation analysis and interpret results.
Q & A
What is the Pearson correlation coefficient used for in Excel?
-The Pearson correlation coefficient is used to measure the strength and direction of the linear relationship between two continuous variables. It ranges from -1 to +1, with 0 indicating no correlation, +1 indicating a perfect positive correlation, and -1 indicating a perfect negative correlation.
How do you calculate the Pearson correlation coefficient in Excel?
-To calculate the Pearson correlation coefficient in Excel, type the formula `=PEARSON(`, then select the range of the first dataset, add a comma, and select the range of the second dataset. Close the parentheses and press Enter to get the correlation coefficient.
What does a Pearson correlation coefficient of 0.76 indicate?
-A Pearson correlation coefficient of 0.76 indicates a strong positive correlation between the two variables, meaning as one variable increases, the other tends to increase as well.
What is the significance of the p-value in a correlation test?
-The p-value helps determine whether the observed correlation is statistically significant. A p-value less than 0.05 typically indicates a statistically significant correlation, suggesting that the relationship between the variables is unlikely to be due to random chance.
How do you calculate the number of data pairs (n) in Excel?
-To calculate the number of data pairs (n) in Excel, use the formula `=COUNT(range)`, where 'range' refers to the cell range of your data. This will count the number of observations in the dataset.
What is the formula for calculating the t-statistic in a Pearson correlation test?
-The formula for calculating the t-statistic in a Pearson correlation test is: T = (r × √(n - 2)) / √(1 - r²), where 'r' is the Pearson correlation coefficient and 'n' is the number of pairs.
How do you calculate the degrees of freedom for a Pearson correlation test?
-The degrees of freedom (df) for a Pearson correlation test is calculated by subtracting 2 from the number of data pairs (n). The formula is: df = n - 2.
What does the T.DIST.2T function in Excel do?
-The T.DIST.2T function in Excel calculates the p-value for a two-tailed test based on the t-statistic and degrees of freedom. The formula is `=T.DIST.2T(t-statistic, degrees_of_freedom)`.
What is the difference between a one-tailed and two-tailed test in the context of a Pearson correlation?
-In a one-tailed test, the p-value tests for correlation in only one direction (either positive or negative), while in a two-tailed test, the p-value tests for correlation in both directions (positive and negative). For most correlation tests, a two-tailed test is used.
Why would you use a two-tailed test in a Pearson correlation test?
-A two-tailed test is used in a Pearson correlation test because it checks for the possibility of a relationship in both directions, whether positive or negative, which provides a more comprehensive analysis of the data.
Outlines

Dieser Bereich ist nur für Premium-Benutzer verfügbar. Bitte führen Sie ein Upgrade durch, um auf diesen Abschnitt zuzugreifen.
Upgrade durchführenMindmap

Dieser Bereich ist nur für Premium-Benutzer verfügbar. Bitte führen Sie ein Upgrade durch, um auf diesen Abschnitt zuzugreifen.
Upgrade durchführenKeywords

Dieser Bereich ist nur für Premium-Benutzer verfügbar. Bitte führen Sie ein Upgrade durch, um auf diesen Abschnitt zuzugreifen.
Upgrade durchführenHighlights

Dieser Bereich ist nur für Premium-Benutzer verfügbar. Bitte führen Sie ein Upgrade durch, um auf diesen Abschnitt zuzugreifen.
Upgrade durchführenTranscripts

Dieser Bereich ist nur für Premium-Benutzer verfügbar. Bitte führen Sie ein Upgrade durch, um auf diesen Abschnitt zuzugreifen.
Upgrade durchführenWeitere ähnliche Videos ansehen

Descriptive Statistics, Correlation Analysis and Regression Analysis by Using Microsoft Excel

Cara Uji Korelasi Dengan SPSS

How to Calculate a Correlation in Microsoft Excel - Pearson's r

Uji Validitas dan Reliabilitas dengan EXCEL - Uji Validitas Pearson Correlation

Contoh Soal dan Pembahasan Korelasi Pearson | Matematika Wajib SMA Kelas XI Kurikulum Merdeka

Cara Menggunakan Rumus IF untuk Menentukan Kelulusan di Excel (LULUS/TIDAK LULUS)
5.0 / 5 (0 votes)
