Pengantar Analisis Regresi dalam Bidang Psikologi dan Ilmu Sosial
Summary
TLDRThis video introduces regression analysis, a statistical method used to predict a dependent variable (Y) based on independent variables (X). It explains the key components, such as the intercept and slope in the regression equation, and the difference between correlation and regression. The video outlines the assumptions behind regression, including linearity and normal distribution, and the importance of significance testing. Examples show how variables like study facilities and enthusiasm impact academic performance. It concludes with discussions on standardized coefficients and multicollinearity, providing essential insights into building reliable regression models.
Takeaways
- 😀 Regression analysis is used to predict the value of a dependent variable based on one or more independent variables.
- 😀 The dependent variable should be continuous (interval or ratio data), while the independent variables can be either continuous or categorical.
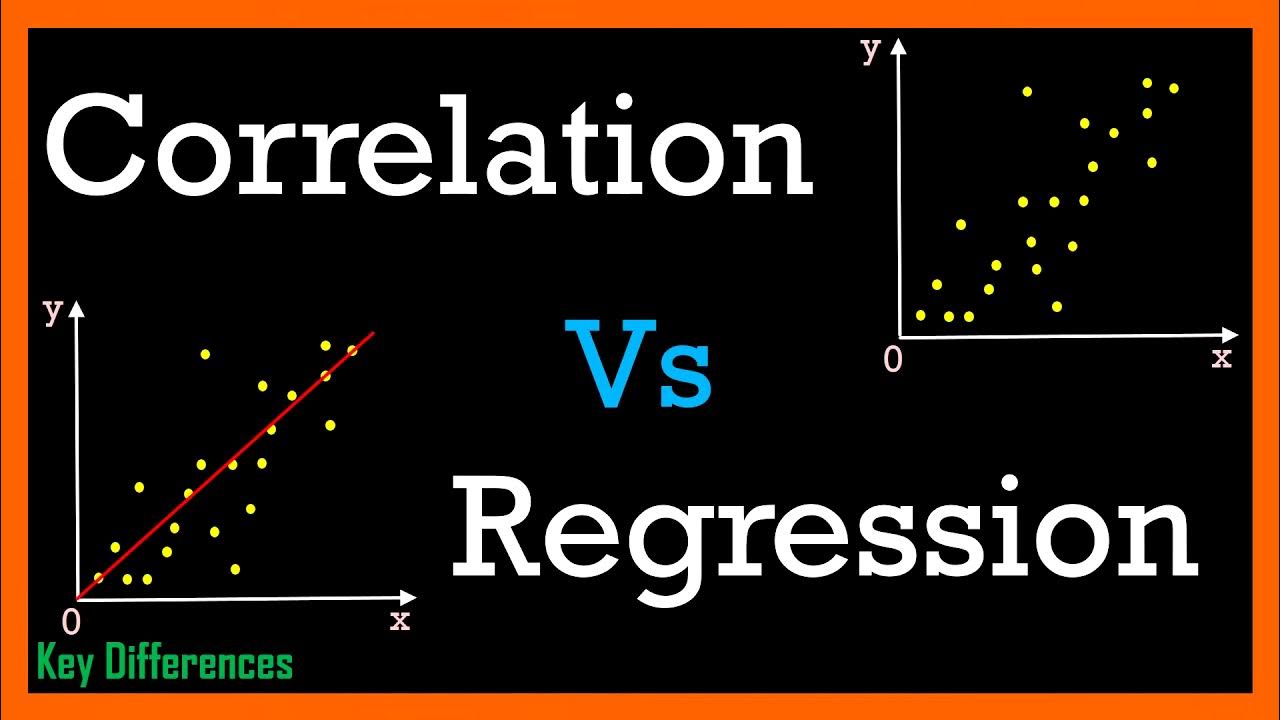
- 😀 A key difference between regression analysis and correlation is that regression predicts the outcome of the dependent variable, while correlation just shows relationships between variables.
- 😀 Regression analysis assumes that data are quantitative, and the distribution of dependent variable values is normal for each level of the independent variable.
- 😀 The relationship between the dependent and independent variables must be linear for regression analysis to work effectively.
- 😀 Homoscedasticity is a key assumption: the variance of the dependent variable must remain constant across different values of the independent variable.
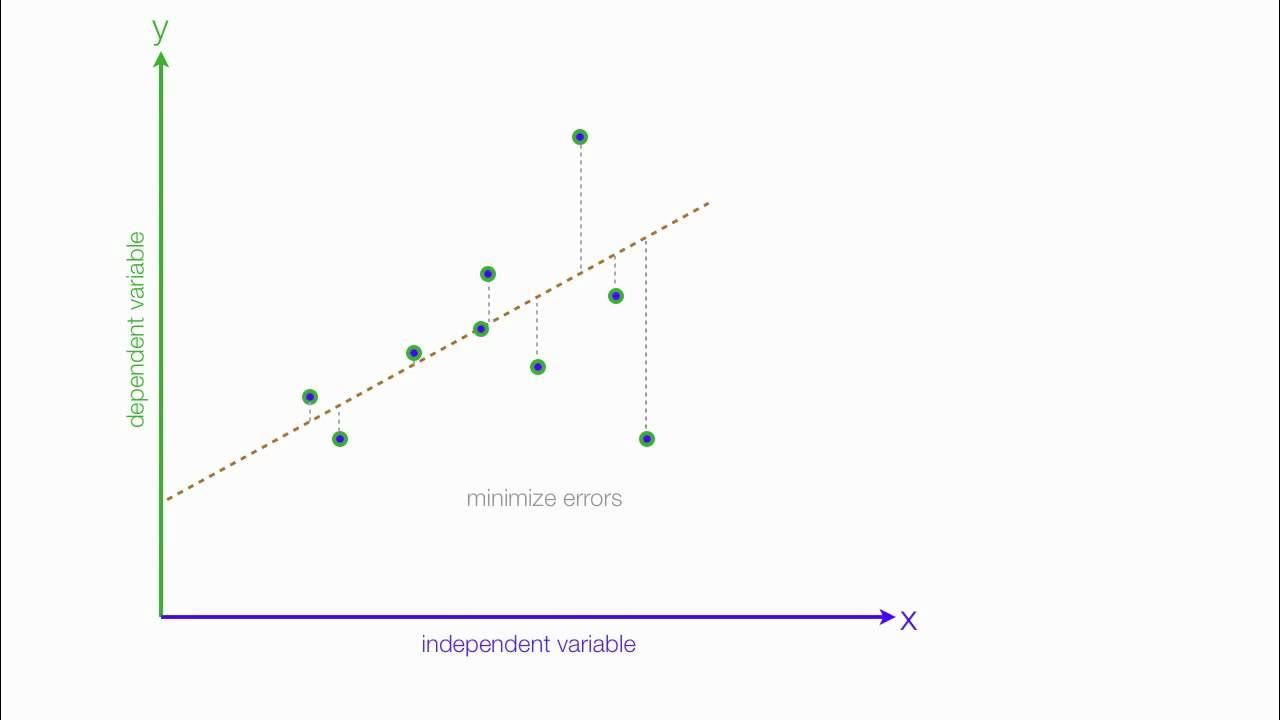
- 😀 In regression, the intercept (B₀) represents the value of the dependent variable when the independent variable is zero, and the slope (B₁) shows the effect of the independent variable on the dependent variable.
- 😀 Positive relationships in regression occur when an increase in the independent variable leads to an increase in the dependent variable, and vice versa for negative relationships.
- 😀 Statistical significance of coefficients is assessed using t-values and p-values; predictors with p-values below 0.05 are considered statistically significant.
- 😀 Standardized coefficients allow comparison of the relative impact of different predictors in the model, with higher coefficients indicating stronger effects.
Q & A
What is regression analysis used for?
-Regression analysis is used to predict the value of a dependent variable (Y) based on one or more independent variables (X). It helps determine the relationship between variables and make predictions.
What types of variables are required for regression analysis?
-For regression analysis, the dependent variable should be continuous, with at least an interval or ratio scale. The independent variable can be continuous or categorical.
How is regression analysis different from correlation analysis?
-In regression analysis, there is a directional relationship between the independent and dependent variables (X → Y), meaning one variable influences the other. In correlation analysis, the relationship is non-directional, simply showing the association between variables without implying cause.
What are the key assumptions made in regression analysis?
-The key assumptions are: 1) Quantitative data for both dependent and independent variables, 2) Normal distribution of independent variable data points, 3) Constant variance (homoscedasticity) of the dependent variable, 4) A linear relationship between variables, and 5) Independence of observations.
What is the role of the intercept (b0) in a regression equation?
-The intercept (b0) represents the value of the dependent variable (Y) when the independent variable (X) is zero. It can be seen as the starting point of the regression line.
What does the slope (b1) in the regression equation indicate?
-The slope (b1) indicates the rate of change in the dependent variable (Y) for each unit change in the independent variable (X). A positive slope means Y increases as X increases, while a negative slope means Y decreases as X increases.
What is the difference between a positive and negative regression relationship?
-In a positive regression relationship, as the independent variable (X) increases, the dependent variable (Y) also increases. In a negative relationship, as X increases, Y decreases.
What does a p-value less than 0.05 indicate in hypothesis testing for regression?
-A p-value less than 0.05 indicates that the predictor variable's coefficient is statistically significant, meaning that the predictor has a reliable impact on the dependent variable and the result is not due to chance.
How are standardized coefficients used in regression analysis?
-Standardized coefficients allow for the comparison of the relative strength of predictors. They are measured on a common scale and indicate which predictor has the greatest impact on the dependent variable, with values closer to 1 or -1 showing stronger influence.
What is multicollinearity, and why is it important in regression analysis?
-Multicollinearity occurs when independent variables in a regression model are highly correlated with each other. It is important to check for multicollinearity because it can distort the results, leading to unreliable coefficient estimates and making it difficult to determine the effect of each predictor.
Outlines

Dieser Bereich ist nur für Premium-Benutzer verfügbar. Bitte führen Sie ein Upgrade durch, um auf diesen Abschnitt zuzugreifen.
Upgrade durchführenMindmap

Dieser Bereich ist nur für Premium-Benutzer verfügbar. Bitte führen Sie ein Upgrade durch, um auf diesen Abschnitt zuzugreifen.
Upgrade durchführenKeywords

Dieser Bereich ist nur für Premium-Benutzer verfügbar. Bitte führen Sie ein Upgrade durch, um auf diesen Abschnitt zuzugreifen.
Upgrade durchführenHighlights

Dieser Bereich ist nur für Premium-Benutzer verfügbar. Bitte führen Sie ein Upgrade durch, um auf diesen Abschnitt zuzugreifen.
Upgrade durchführenTranscripts

Dieser Bereich ist nur für Premium-Benutzer verfügbar. Bitte führen Sie ein Upgrade durch, um auf diesen Abschnitt zuzugreifen.
Upgrade durchführenWeitere ähnliche Videos ansehen

Statistics 101: Multiple Linear Regression, The Very Basics 📈

Correlation Vs Regression: Difference Between them with definition & Comparison Chart

REGRESSION AND CORRELATION EDDIE SEVA SEE

Using Multiple Regression in Excel for Predictive Analysis

An Introduction to Linear Regression Analysis

35. Regressione Lineare Semplice (Spiegata passo dopo passo)
5.0 / 5 (0 votes)
