Cara Menghitung Statistik Deskriptif dengan Excel || Statistik Excel
Summary
TLDRIn this tutorial, the presenter shares how to calculate descriptive statistics using the Data Analysis feature in Microsoft Excel. After setting up a dataset of 15 values, viewers are guided through the process of accessing the Data Analysis tool, selecting descriptive statistics, and interpreting the output. Key statistical measures like mean, median, mode, standard deviation, kurtosis, minimum, maximum, and sample size are explained. The tutorial emphasizes the importance of following the steps accurately and invites viewers to subscribe for more Excel tips and tutorials, making it a valuable resource for anyone looking to enhance their data analysis skills.
Takeaways
- 📊 Takeaway 1: This tutorial demonstrates how to calculate descriptive statistics using the Data Analysis feature in Microsoft Excel.
- 📝 Takeaway 2: The dataset used in the tutorial consists of 15 numerical values.
- 🔍 Takeaway 3: To access the Data Analysis tool, navigate to the Data tab and click on Data Analysis.
- ⚙️ Takeaway 4: If the Data Analysis option is not visible, users may need to enable it through Excel settings.
- 📈 Takeaway 5: In the Data Analysis dialog box, select 'Descriptive Statistics' and click OK to proceed.
- 🔢 Takeaway 6: Input the data range in the Descriptive Statistics window and choose to group data by columns.
- 📋 Takeaway 7: Check the 'Labels in First Row' option if the selected data includes headers.
- 📤 Takeaway 8: Users can specify the output location for the statistical results, either in the same worksheet or a new one.
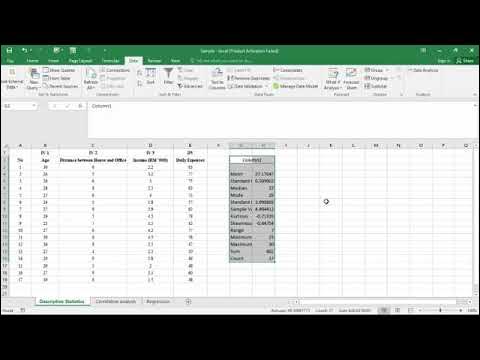
- 📉 Takeaway 9: The resulting output includes key statistics such as mean, median, mode, and standard deviation.
- 💡 Takeaway 10: The video encourages sharing the tutorial and subscribing for more Excel tips and tutorials.
Q & A
What is the main focus of the tutorial?
-The tutorial focuses on how to calculate descriptive statistics using the Data Analysis feature in Microsoft Excel.
What types of descriptive statistics are mentioned in the tutorial?
-The tutorial covers mean, median, mode, standard deviation, sample variance, kurtosis, skewness, minimum, maximum, sum, and count.
How many data points does the tutorial use for the analysis?
-The tutorial uses a dataset consisting of 15 data points.
What steps are needed to activate the Data Analysis feature in Excel?
-Users need to follow a separate tutorial provided in the description to install the Data Analysis ToolPak if it is not already available in their Excel.
What should be done after selecting 'Descriptive Statistics' in the Data Analysis window?
-After selecting 'Descriptive Statistics', users need to input their data range, choose the output options, and select various statistical measures before clicking OK.
What output options can users choose from?
-Users can choose to display the output in the same worksheet, a new worksheet, or a new workbook.
What does the 'Mean' value represent in the output?
-The 'Mean' value represents the average of the dataset.
What is the significance of the 'Standard Deviation' in descriptive statistics?
-Standard deviation indicates the amount of variation or dispersion in the dataset.
How does the tutorial address the selection of labels in the dataset?
-The tutorial explains that if labels are included in the selection, the 'Labels in First Row' option should be checked.
What is suggested if the video is found useful?
-Viewers are encouraged to share the video with others who might find it helpful and to subscribe for more Excel tutorials and tips.
Outlines

Dieser Bereich ist nur für Premium-Benutzer verfügbar. Bitte führen Sie ein Upgrade durch, um auf diesen Abschnitt zuzugreifen.
Upgrade durchführenMindmap

Dieser Bereich ist nur für Premium-Benutzer verfügbar. Bitte führen Sie ein Upgrade durch, um auf diesen Abschnitt zuzugreifen.
Upgrade durchführenKeywords

Dieser Bereich ist nur für Premium-Benutzer verfügbar. Bitte führen Sie ein Upgrade durch, um auf diesen Abschnitt zuzugreifen.
Upgrade durchführenHighlights

Dieser Bereich ist nur für Premium-Benutzer verfügbar. Bitte führen Sie ein Upgrade durch, um auf diesen Abschnitt zuzugreifen.
Upgrade durchführenTranscripts

Dieser Bereich ist nur für Premium-Benutzer verfügbar. Bitte führen Sie ein Upgrade durch, um auf diesen Abschnitt zuzugreifen.
Upgrade durchführenWeitere ähnliche Videos ansehen
5.0 / 5 (0 votes)


