Lecture 2 - Statistics - Organizing Data
Summary
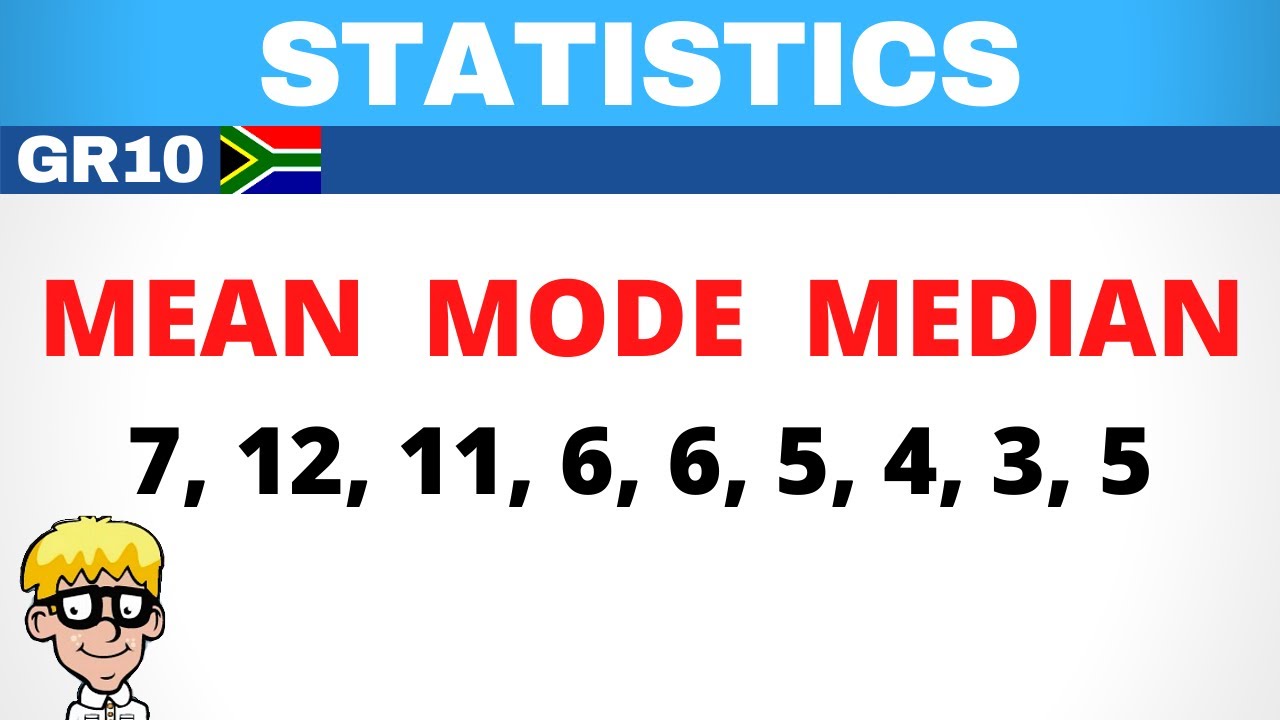
TLDRThis video provides an overview of key statistical concepts such as the mean, median, mode, and weighted average, explaining how to calculate each. It also touches on the concept of frequency tables and how they can be used to summarize data quickly for analysis. The video emphasizes the importance of understanding the distribution of data, including skewed distributions, and how these measures are affected. The goal is to make these statistical concepts accessible for learners and offer tools for efficiently analyzing data using software like Excel and SPSS.
Takeaways
- 😀 The median is calculated by ordering data and finding the middle value; if there’s an even number of data points, take the average of the two middle values.
- 😀 The mean is found by summing all data values and dividing by the number of data points; it is often used as the average.
- 😀 A symmetrical, bell-shaped distribution ideally has the mean, median, and mode all in the same spot.
- 😀 In a skewed left distribution, the mode is the highest, followed by the median and then the mean.
- 😀 In a skewed right distribution, the mean is the highest, followed by the median and then the mode.
- 😀 Sample statistics use a small 'n' to represent data from a sample, while population statistics use a capital 'N' for the entire population.
- 😀 A weighted average is calculated by multiplying each data point by its weight (usually a percentage) and dividing by the total of the weights.
- 😀 When dealing with large datasets, a frequency table can be used to summarize the data, showing the number of occurrences of each value.
- 😀 To calculate the mean from a frequency table, multiply each value by its frequency and sum the results.
- 😀 A frequency table helps speed up the calculation of the mean by summarizing repeated data values and their frequencies.
- 😀 Future lessons will cover how to perform statistical calculations and create charts using tools like Excel and SPSS for efficiency.
Q & A
What is the difference between the mean and the median in statistics?
-The mean is the average of a data set, calculated by summing all the values and dividing by the number of values. The median is the middle value when the data set is ordered. If there is an even number of values, the median is the average of the two middle values.
How do you calculate the median when there are an even number of data points?
-When there is an even number of data points, you calculate the median by averaging the two middle values in the ordered data set.
What is the ideal situation for the mean, median, and mode in a data set?
-The ideal situation is when the mean, median, and mode are all equal. This typically occurs in a perfectly symmetrical, bell-shaped distribution.
What does a skewed left distribution look like in terms of the mean, median, and mode?
-In a skewed left distribution, the mode is the highest value, the median is next, and the mean is the smallest value.
How does a skewed right distribution affect the arrangement of the mean, median, and mode?
-In a skewed right distribution, the mode is the smallest value, the median is the next largest, and the mean is the largest.
What is a weighted average and how is it calculated?
-A weighted average is calculated by multiplying each data value by its respective weight, summing the products, and then dividing by the sum of the weights.
What does the weight in a weighted average represent?
-The weight in a weighted average typically represents the importance or frequency of a data value, often given as a percentage.
What is the benefit of using frequency tables in statistics?
-Frequency tables allow you to summarize data efficiently, especially for large datasets. They show how many times each value appears and can help in quickly calculating averages or other statistics.
How do you calculate the mean using a frequency table?
-To calculate the mean using a frequency table, you multiply each data value by its corresponding frequency, sum these products, and then divide by the total frequency (sum of all occurrences).
What is the difference between sample statistics and population statistics?
-Sample statistics are based on a subset of data (represented by lowercase 'n'), while population statistics are based on the entire population of data (represented by uppercase 'N').
Outlines

Dieser Bereich ist nur für Premium-Benutzer verfügbar. Bitte führen Sie ein Upgrade durch, um auf diesen Abschnitt zuzugreifen.
Upgrade durchführenMindmap

Dieser Bereich ist nur für Premium-Benutzer verfügbar. Bitte führen Sie ein Upgrade durch, um auf diesen Abschnitt zuzugreifen.
Upgrade durchführenKeywords

Dieser Bereich ist nur für Premium-Benutzer verfügbar. Bitte führen Sie ein Upgrade durch, um auf diesen Abschnitt zuzugreifen.
Upgrade durchführenHighlights

Dieser Bereich ist nur für Premium-Benutzer verfügbar. Bitte führen Sie ein Upgrade durch, um auf diesen Abschnitt zuzugreifen.
Upgrade durchführenTranscripts

Dieser Bereich ist nur für Premium-Benutzer verfügbar. Bitte führen Sie ein Upgrade durch, um auf diesen Abschnitt zuzugreifen.
Upgrade durchführen


5.0 / 5 (0 votes)
