One Way Analysis of Variance
Summary
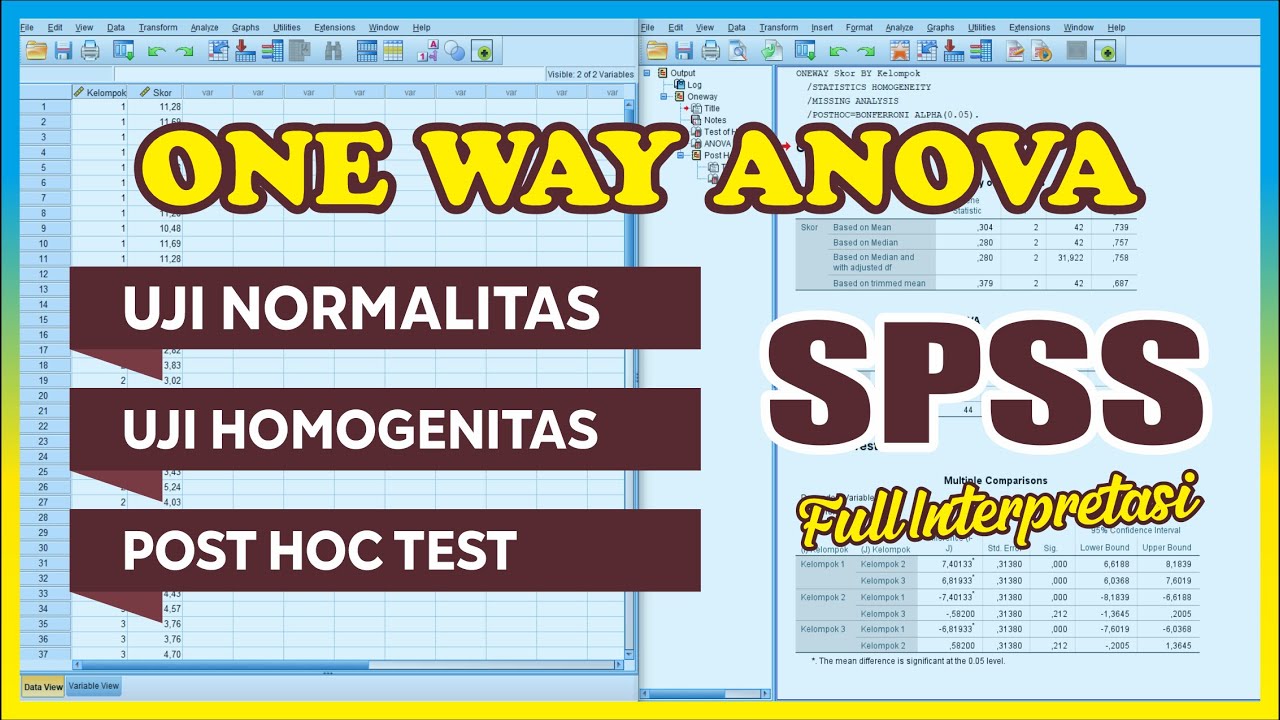
TLDRThis video tutorial offers a comprehensive guide to one-way ANOVA, focusing on its application using SPSS software and the interpretation of results. It explains the suitability of one-way ANOVA for nominal or ordinal independent variables with three or more categories. The tutorial emphasizes the importance of data normality and variance homogeneity. It demonstrates how to perform the test in SPSS, check assumptions, and interpret the ANOVA table to determine if there are significant differences between groups. The video concludes with a step-by-step guide to post-hoc analysis for pairwise comparisons, providing practical insights for researchers.
Takeaways
- 🔍 One-way ANOVA is a statistical method used to compare the means of three or more groups to determine if there are significant differences among them.
- 📊 The independent variable in a one-way ANOVA should be categorical with three or more categories, such as different tribes in the example provided.
- 📈 Before conducting a one-way ANOVA, it's crucial to ensure that the data is normally distributed and the groups have equal variance, also known as homogeneity of variance.
- 📝 The null hypothesis in a one-way ANOVA typically states that there is no significant difference in the dependent variable (e.g., positive effect) across the different groups.
- 📊 The F-statistic is a key result from the ANOVA test, representing the ratio of between-group variance to within-group variance.
- 📋 The decision to accept or reject the null hypothesis is based on the p-value; if p < 0.05, the null hypothesis is rejected, indicating a significant difference between the groups.
- 💻 The video demonstrates how to perform a one-way ANOVA using SPSS, including data preparation, analysis, and interpretation of results.
- 📊 Descriptive statistics and tests of homogeneity of variance, such as Levene's test, are important preliminary steps before conducting the ANOVA.
- 📊 The video shows how to interpret the ANOVA table, including the F-statistic and its significance, to determine if there are significant differences between the groups.
- 📊 Post-hoc analysis, such as pairwise comparisons, can be conducted after a significant ANOVA result to understand which specific groups differ from each other.
Q & A
What is the main topic of the video series?
-The main topic of the video series is research methods and analysis, focusing on one-way ANOVA.
What is one-way ANOVA and when can it be used?
-One-way ANOVA is a statistical method used to compare the means of three or more independent groups to determine if there are any significant differences between them. It can be used when the independent variable is categorical with three or more categories.
What are the assumptions required for conducting a one-way ANOVA?
-The assumptions for one-way ANOVA include normal distribution of data, homogeneity of variances among groups, and the independence of observations.
How does the video demonstrate the process of conducting one-way ANOVA using SPSS?
-The video demonstrates the process by showing the steps in SPSS, including selecting the dependent and independent variables, checking for homogeneity of variances, and interpreting the ANOVA table and post-hoc tests.
What does the video suggest for checking the homogeneity of variances?
-The video suggests using Levene's test for checking the homogeneity of variances, and it shows how to interpret the test results in SPSS.
What is the null hypothesis in the context of the video's one-way ANOVA example?
-The null hypothesis in the video's example is that there is no significant difference in the positive effect among the three tribes.
How does the video interpret the results of the one-way ANOVA test?
-The video interprets the results by looking at the F-statistic and the p-value. If the p-value is less than 0.05, the null hypothesis is rejected, indicating a significant difference between the groups.
What is the significance of the p-value in the context of the video?
-The p-value determines the significance of the results. A p-value less than 0.05 indicates that the observed difference is statistically significant, while a p-value greater than 0.05 suggests no significant difference.
How does the video handle post-hoc analysis after the ANOVA test?
-The video performs post-hoc analysis using pairwise comparisons to determine which specific groups differ from each other in terms of the positive effect.
What is the conclusion regarding the positive effect among the three tribes based on the video?
-The conclusion is that there is a significant difference in the positive effect among the three tribes, with Tribe 2 having the highest effect and Tribe 1 having a higher effect than Tribe 3.
How can viewers reach out with questions or suggestions about the video content?
-Viewers can reach out with questions, suggestions, or recommendations by emailing [email protected].
Outlines
📊 Introduction to One-Way ANOVA
This video segment introduces the concept of one-way ANOVA, a statistical method used to compare the means of three or more independent groups. It explains that one-way ANOVA is applicable when the independent variable is categorical with three or more levels. The example given is a study comparing the positive effect scores of three different tribes. Before conducting the analysis, it's crucial to ensure that the data is normally distributed and that the variances among the groups are equal. The video describes the process of conducting a one-way ANOVA in SPSS, starting with checking the assumptions of normality and homogeneity of variance, and then proceeding with the analysis. The focus is on understanding the variance between groups and within groups, and how the F-statistic is calculated. The segment ends with a brief mention of the output, including the ANOVA table and post-hoc tests.
📈 Analyzing and Interpreting One-Way ANOVA Results
This segment delves into the interpretation of one-way ANOVA results obtained from SPSS. It discusses the steps to analyze the data, including checking for homogeneity of variance using Levene's test and examining the descriptive statistics. The video then explains how to interpret the ANOVA table, focusing on the F-statistic and its associated p-value to determine if there are significant differences between the groups. The null hypothesis is that there is no difference in positive effect among the three tribes, and the decision to accept or reject this hypothesis is based on the p-value. The mean and standard deviation of each tribe are also discussed to understand the magnitude of the differences. Post-hoc pairwise comparisons are then analyzed to determine which specific groups differ significantly from each other. The video concludes with a call to action for viewers to reach out with questions or suggestions.
Mindmap
Keywords
💡One-way ANOVA
💡Independent Variable
💡Nominal and Ordinal Level of Measurement
💡Categorical Data
💡Normal Distribution
💡Homogeneity of Variance
💡SPSS
💡Null Hypothesis
💡Post Hoc Analysis
💡Descriptives
💡Significance Level (p-value)
Highlights
Introduction to one-way ANOVA and its application in research methods and analysis.
One-way ANOVA is suitable for nominal or ordinal independent variables with three or more categories.
Data must be normally distributed and have equal variances among groups for ANOVA.
The focus is on variance between groups and within groups in the distribution of positive effects.
ANOVA coefficient (F) is calculated as the ratio of between-group variance to within-group variance.
ANOVA is a parametric test with specific assumptions that must be met.
Null hypothesis in one-way ANOVA: No difference in positive effect among Tribe 1, Tribe 2, and Tribe 3.
Demonstration of conducting one-way ANOVA using SPSS software.
Data view in SPSS includes variables like tribes, gender, age, and positive effect.
Procedure to select variables and conduct one-way ANOVA in SPSS.
Options for descriptives and test of homogeneity of variance in SPSS.
Interpretation of Levene's test for homogeneity of variance with an F score and p-value.
Steps to copy and paste statistical tables from SPSS output for further analysis.
ANOVA table interpretation including F and p-values to determine significance.
Mean and standard deviation analysis to compare positive effect among tribes.
Post hoc analysis for pairwise comparisons between tribes using SPSS.
Significance testing for mean differences in positive effect between Tribe 1 and Tribe 2.
Significance testing for mean differences in positive effect between Tribe 1 and Tribe 3.
Significance testing for mean differences in positive effect between Tribe 2 and Tribe 3.
Conclusion on the significant difference in positive effect among the three tribes.
Invitation for questions, suggestions, or recommendations via email.
Transcripts
welcome to the video series on
research methods and analysis by data
and research
in this video we will learn about one
way anova
how to do it using spss and how to
interpret the result
we can do one way anova if the
independent variable is in the nominal
or ordinal level of measurement
or are categorical in nature
with three or more categories for
instance
imagine we are doing research in a
sample from three
different tribes we plan to find
out if three tribes are different in
their positive effect
before doing the analysis we have to
make sure that the data is
normally distributed and
three groups are homogeneous or equal in
their variance while considering the
distribution of the positive affects
scores
consider these as the curves of the
distribution of the schools of
each of the three groups
these are the mean and variance of the
distribution
in each of the three groups
while doing anova the first thing we are
concerned with
is the variance in the distribution of
the positive effect
between the groups the second
important thing we consider is
the variance of the distribution of
the positive effect within the group
anoa's coefficient is represented by
f which is equal to between group
variance upon within group variance
anova is a distribution dependent test
or parametric test with these
assumptions
using one way anova let us see if the
null hypothesis
tribe 1 tribe 2 and tribe 3 do not
differ in positive
effect we will do the analysis using
spss
this is the data view of spss we have
four variables here
tribes gender age and positive effect
among these we are concerned with two
variables tribes and posse effect
here we can see tribes categorized into
one
two and three
while doing the analysis in spss
we will choose the tab
analyze then compare
means and then one way anova
a small window will appear our variables
are here
we will shift positive effect
to the dependent list and
try to the factor list
if we check options a new window will
appear here we will get options to check
descriptives
and the test of homogeneity
[Music]
continue
if we check pause
a new window will appear with the range
of statistical tools and posture
analysis
as i assume that my data is homogeneous
in distribution i am checking q key
then continue
then click ok
[Music]
and the output is here just below the
descriptives
we can see the table on test of
homogeneity below that anova table
and below that you keep post analysis or
pairwise comparisons
among these i am
copying the table on test of homogeneity
and pasting it in an excel sheet
removing the degrees of freedom and
copying the rest
this is the table of levine's test on
homogeneity or
equality of variance
levine's f score is 1.41
and p is 0.249
which is greater than 0.05 that means
there is no significant difference
between the groups in their variation
of the distribution from the mean hence
there is a homogeneity of variance or
equality of variance
going back to sps's output this is the
table on descriptives i am copying
descriptives
from here pasting it in the excel sheet
removing the information which i do not
want to show in the table
making some modifications
adding columns for f and
p copying anova table from the output
view
pasting it in the excel sheet
adding the information of f and
it significance or p
making necessary modifications
and copying it
this is the anova innovative our null
hypothesis is tribe 1
tribe 2 and tribe 3 do not differ in
positive effect
we will have to accept the null
hypothesis if p is greater than 0.05 and
reject the null hypothesis if p
is lesser than 0.05
this is f the coefficient that shows the
difference between tribe 1 tribe 2 and
tribe 3 in positive effect
and this is p or probability which shows
if f
is significant or not p is lesser than
0.05
so we will have to reject the null
hypothesis
referring to the mean and standard
deviation tribe 2
is the highest in positive effect tribe
one
is higher than tribe three in positive
effect altogether there is a significant
difference between the three groups in
positive effect
here is the sps's output for two key
post analysis i am copying it
pasting it in an excel sheet removing
the information which i do not want to
show in the table
this is the tip while comparing tribe 1
and tribe 2 the mean difference of the
positive effect between the participants
from tribe 1 and tribe 2 is 1.33
probability is 0.722 which is greater
than
0.05 we have to accept the null
hypothesis here because there is no
significant difference between tribe 1
and tribe 2 in positive effect
now while comparing tribe 1 and tribe 3
the mean difference is
5.2 p or probability is lesser than 0.05
we have to reject the null hypothesis
here because there is a significant
difference between tribe 1
and tribe 3. we already looked the
difference between tribe 1 and tribe 2.
comparing tribe 2 and tribe 3 the mean
difference is
6.5 p or probability is less than
0.05 we have to reject the null
hypothesis because there is a
significant difference between tribe 2
and tribe 3.
this we already referred
this also we already referred
hope you enjoy doing one way anova if
you
have any questions suggestions or
recommendations please write
to dnr365 gmail.com
Weitere ähnliche Videos ansehen
What Is Anova? | Introduction To Analysis And Variance | Anova Explained | Simplilearn
SPSS tutorial in tamil for beginners part -1 | Introduction
How to Perform and Interpret Independent Sample T-Test in SPSS
一夜。統計學:相關分析
Analisis Statistik Deskriptif dengan SPSS beserta Interpretasinya
Interpreting Output for Multiple Regression in SPSS
5.0 / 5 (0 votes)