What is DFD? How to design DFD, Symbols, examples full explanation
Summary
TLDRThe video script explains the concept of a Data Flow Diagram (DFD), a graphical representation of data movement within a system. It highlights the importance of DFDs in analyzing both existing and proposed systems, illustrating how data flows from one module to another. Key elements such as external entities, data flows, processes, and data stores are discussed, with emphasis on their roles in the system. The script also outlines the rules governing data flow, emphasizing that direct communication between entities or data stores without a process is invalid. This overview is crucial for understanding system design and data management in applications like mobile apps and databases.
Takeaways
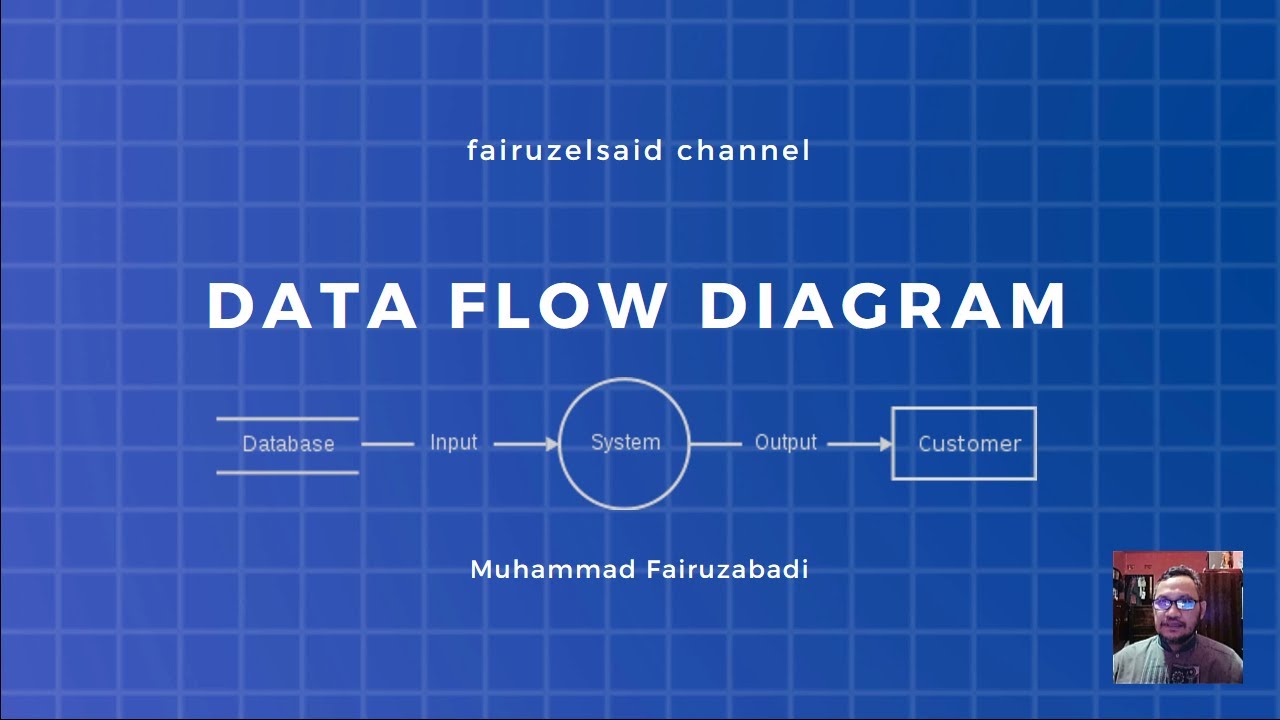
- 📊 **Data Flow Diagram (DFD) Purpose**: DFD is a graphical tool used to represent the 'flow' of data through an information system, modeling the system's process and data movement.
- 🔍 **Why Use DFD?**: It helps in visualizing the system's processes and data flow, aiding in understanding and analyzing both existing and proposed systems.
- 📱 **Application Example**: The script uses the example of a mobile app, like 'Gate Smashers', to explain how DFD can represent the navigation between different pages and modules.
- 👤 **Entities (External Entities)**: DFD includes entities that interact with the system, such as users, which are shown as sources or sinks of data.
- 🔄 **Data Flow**: Data movement within the system is depicted using arrows, indicating the direction and path of data transfer.
- ⭕ **Processes**: Circular shapes represent processes, which are the actions performed on data, like issuing or returning a book in a library system.
- 💾 **Data Stores/Databases**: Parallel lines symbolize data stores or databases, where data is stored, read from, or written to.
- 🚫 **Rules of Data Flow**: The script emphasizes that data can flow between entities and processes, processes and data stores, but not directly between entities or stores without involving processes.
- 🌟 **Key Elements**: The four main elements of DFD are external entities, data flow, processes, and data stores, with the script highlighting their importance in system analysis.
- 📝 **Practical Focus**: The script advises focusing on practical understanding over deep theory, especially for competitive exams where application of concepts is more important than theoretical knowledge.
Q & A
What is the primary purpose of a Data Flow Diagram (DFD)?
-The primary purpose of a Data Flow Diagram (DFD) is to graphically represent the flow of data within an information system, illustrating the movement of data from one module to another and how it is processed.
Why are Data Flow Diagrams important in software development?
-Data Flow Diagrams are important in software development because they help in visualizing the system's data flow, which aids in understanding the system's structure and functionality, facilitating communication among stakeholders, and analyzing both existing and proposed systems.
Can you explain the concept of 'entity' in the context of DFD?
-In DFD, an 'entity' or 'external entity' refers to a source or sink that interacts with the system by providing input (source) or receiving output (sink). It can be a user, a department, or any external system that exchanges data with the system being modeled.
What does the term 'data flow' represent in a DFD?
-In a Data Flow Diagram, 'data flow' represents the movement of data between different components of the system. It is depicted as arrows that show the direction and path of data as it is processed and transferred within the system.
How are processes depicted in a DFD, and what do they signify?
-Processes in a DFD are typically represented by circles. They signify the work being done within the system, such as data transformation or manipulation, and are the actions that change the state or data within the system.
What is the role of a 'data store' in a DFD?
-A 'data store' in a DFD, often represented by parallel lines, signifies a place where data is stored, such as a database or a file. It indicates where data is kept, retrieved, updated, or deleted within the system.
What are the four main elements of a DFD?
-The four main elements of a Data Flow Diagram are: 1) External Entities (sources or sinks), 2) Data Flows (represented by arrows), 3) Processes (represented by circles), and 4) Data Stores (represented by parallel lines).
What is the significance of the term 'bubble chart' in relation to DFDs?
-The term 'bubble chart' is another name for a Data Flow Diagram, emphasizing its graphical nature where the 'bubbles' represent different processes or components within the system, and the connections between them show the flow of data.
Why are rules of data flow important in DFD?
-Rules of data flow are important in DFD because they dictate the valid pathways for data movement within the system. These rules ensure that the diagram accurately reflects the system's operations and helps in identifying any potential issues or inefficiencies in data handling.
Can data flow directly between external entities without involving a process in a DFD?
-No, in a DFD, data cannot flow directly between external entities without involving a process. Data must pass through a process, which acts as an intermediary, ensuring that the flow of data is controlled and documented.
How does a DFD help in the analysis of an existing or proposed system?
-A DFD helps in the analysis of an existing or proposed system by providing a clear visual representation of how data moves through the system. It allows analysts to identify the sequence of data processing, potential bottlenecks, and areas for improvement, which is crucial for system design and optimization.
Outlines

Dieser Bereich ist nur für Premium-Benutzer verfügbar. Bitte führen Sie ein Upgrade durch, um auf diesen Abschnitt zuzugreifen.
Upgrade durchführenMindmap

Dieser Bereich ist nur für Premium-Benutzer verfügbar. Bitte führen Sie ein Upgrade durch, um auf diesen Abschnitt zuzugreifen.
Upgrade durchführenKeywords

Dieser Bereich ist nur für Premium-Benutzer verfügbar. Bitte führen Sie ein Upgrade durch, um auf diesen Abschnitt zuzugreifen.
Upgrade durchführenHighlights

Dieser Bereich ist nur für Premium-Benutzer verfügbar. Bitte führen Sie ein Upgrade durch, um auf diesen Abschnitt zuzugreifen.
Upgrade durchführenTranscripts

Dieser Bereich ist nur für Premium-Benutzer verfügbar. Bitte führen Sie ein Upgrade durch, um auf diesen Abschnitt zuzugreifen.
Upgrade durchführenWeitere ähnliche Videos ansehen
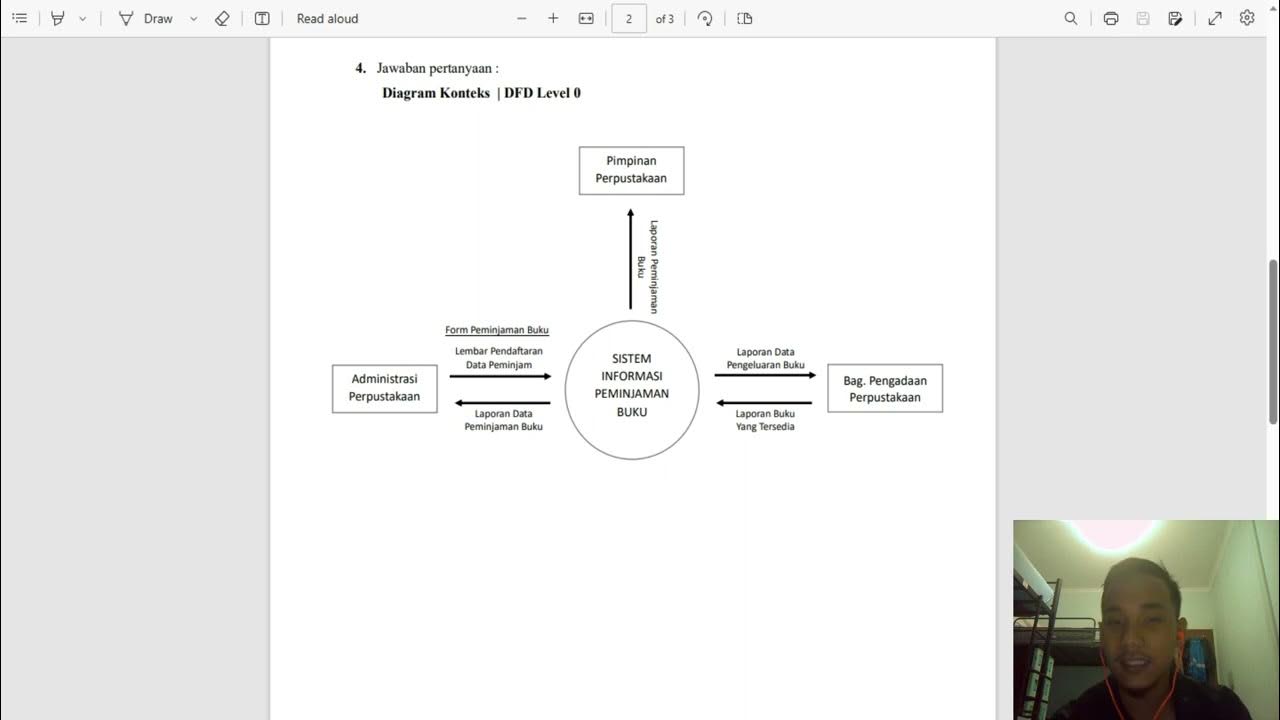
Diagram Konteks | DFD Level 0 dan DFD Level 1 | Sistem Informasi Peminjaman Buku

Chapter 7 Session 4 Part II: Stonehurst Place Example: Connecting Human Interfaces and DFD-0
Data Flow Diagram (DFD): Definisi, Sejarah, Notasi, Tahap dan Tipsnya.
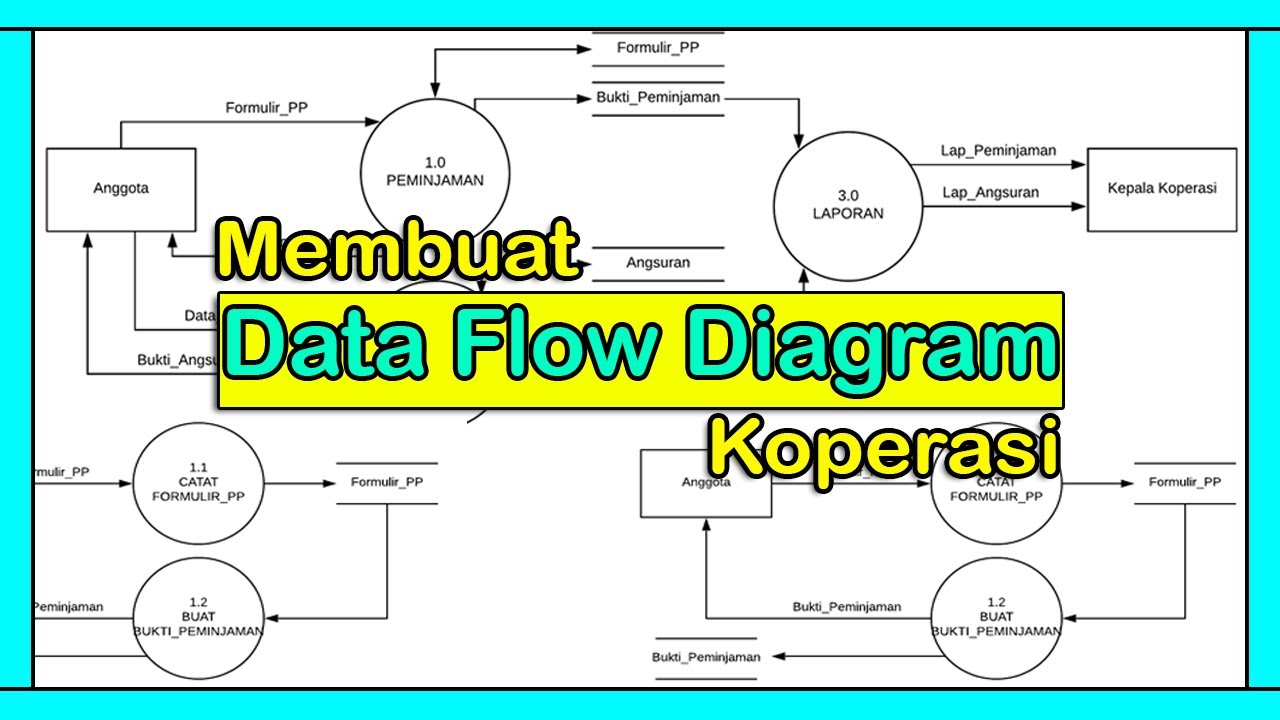
Tutorial Membuat DFD (Data Flow Diagram) | Studi Kasus Koperasi

Data Flow Diagram Level 0 | Analisis dan Desain Sistem

Data Flow Diagram: Pegertian Simbol | Analisis dan Desain Sistem
5.0 / 5 (0 votes)
