Standard Deviation Formula, Statistics, Variance, Sample and Population Mean
Summary
TLDRThis educational video script explains the process of calculating standard deviation, both for a population and a sample. It introduces two formulas: one for population standard deviation (using the population mean, μ, and dividing by n) and another for sample standard deviation (using the sample mean and dividing by n-1). The script uses the example of two sets of numbers, 4, 5, 6 and 3, 5, 7, to demonstrate the calculation, highlighting that the set with more spread out numbers will have a higher standard deviation. It also touches on the concept of variance, which is the square of the standard deviation. The video concludes by inviting viewers to explore more educational content on the creator's channel and website.
Takeaways
- 📐 The video explains how to calculate standard deviation, which measures how spread out numbers are in a set.
- 🔢 There are two formulas for standard deviation: one for the entire population and one for a sample of the population.
- 👫 The population standard deviation (σ) is calculated by summing the squared differences from the mean (μ), divided by the number of data points (n), and then taking the square root.
- 🔄 For a sample standard deviation (s), the formula is similar but divides by n-1 instead of n, accounting for the sample size.
- 📊 The video uses an example with the sets 4, 5, 6 and 3, 5, 7 to illustrate that the latter has a greater standard deviation due to its numbers being more spread out.
- 🧮 To calculate the mean, sum all numbers and divide by the count, which for evenly spaced numbers will be the middle value.
- 📉 The process for calculating standard deviation involves subtracting the mean from each number, squaring the result, summing these squares, dividing by n (or n-1), and taking the square root.
- 🔍 The video demonstrates the calculation for the set 3, 5, 7, resulting in a standard deviation of approximately 1.63.
- 📈 The variance is the square of the standard deviation and is calculated by summing the squared differences from the mean and dividing by n (or n-1), without taking the square root.
- 🌐 The video concludes by mentioning that the process for calculating population and sample standard deviation is similar, with the main difference being the divisor (n vs. n-1).
Q & A
What is the population standard deviation formula?
-The population standard deviation formula is represented by sigma (σ). It is equal to the square root of the sum of the squared differences between each data point and the population mean (μ), divided by the total number of data points (N).
How does the sample standard deviation formula differ from the population standard deviation formula?
-The sample standard deviation formula differs from the population standard deviation in that it divides by (N - 1) instead of N. This adjustment is made to account for the fact that the data set is only a sample of the entire population.
What does standard deviation measure?
-Standard deviation measures how spread out the numbers in a data set are in relation to each other. A higher standard deviation indicates that the numbers are more spread out, while a lower standard deviation indicates that the numbers are closer together.
Why does the set of numbers 3, 5, and 7 have a higher standard deviation than the set 4, 5, and 6?
-The set of numbers 3, 5, and 7 has a higher standard deviation because the numbers are more spread out compared to the set 4, 5, and 6. The differences between each number and the mean are larger in the first set.
How do you calculate the mean of a data set?
-To calculate the mean of a data set, sum all the numbers in the set and then divide by the total number of data points.
What are the steps to calculate the population standard deviation?
-First, calculate the mean of the data set. Then, subtract the mean from each data point and square the result. Sum all the squared differences, divide by the total number of data points (N), and finally, take the square root of the result.
How would you calculate the standard deviation for the numbers 3, 5, and 7?
-First, calculate the mean, which is 5. Then, find the differences between each number and the mean, square those differences, sum them, and divide by the number of data points (3). Finally, take the square root of the result, which gives a standard deviation of approximately 1.63.
What is the variance and how is it related to standard deviation?
-Variance is the square of the standard deviation. It measures the average of the squared differences from the mean. For example, if the standard deviation is 1.63, the variance would be 1.63 squared, approximately 2.66.
Why do you use N - 1 in the sample standard deviation formula instead of N?
-N - 1 is used in the sample standard deviation formula to correct for bias in the estimation of the population variance. This adjustment, known as Bessel's correction, accounts for the fact that a sample may not fully represent the entire population.
What subjects does the instructor offer on their website?
-The instructor offers tutorials on algebra, trigonometry, pre-calculus, calculus, chemistry, and physics on their website.
Outlines

Dieser Bereich ist nur für Premium-Benutzer verfügbar. Bitte führen Sie ein Upgrade durch, um auf diesen Abschnitt zuzugreifen.
Upgrade durchführenMindmap

Dieser Bereich ist nur für Premium-Benutzer verfügbar. Bitte führen Sie ein Upgrade durch, um auf diesen Abschnitt zuzugreifen.
Upgrade durchführenKeywords

Dieser Bereich ist nur für Premium-Benutzer verfügbar. Bitte führen Sie ein Upgrade durch, um auf diesen Abschnitt zuzugreifen.
Upgrade durchführenHighlights

Dieser Bereich ist nur für Premium-Benutzer verfügbar. Bitte führen Sie ein Upgrade durch, um auf diesen Abschnitt zuzugreifen.
Upgrade durchführenTranscripts

Dieser Bereich ist nur für Premium-Benutzer verfügbar. Bitte führen Sie ein Upgrade durch, um auf diesen Abschnitt zuzugreifen.
Upgrade durchführenWeitere ähnliche Videos ansehen
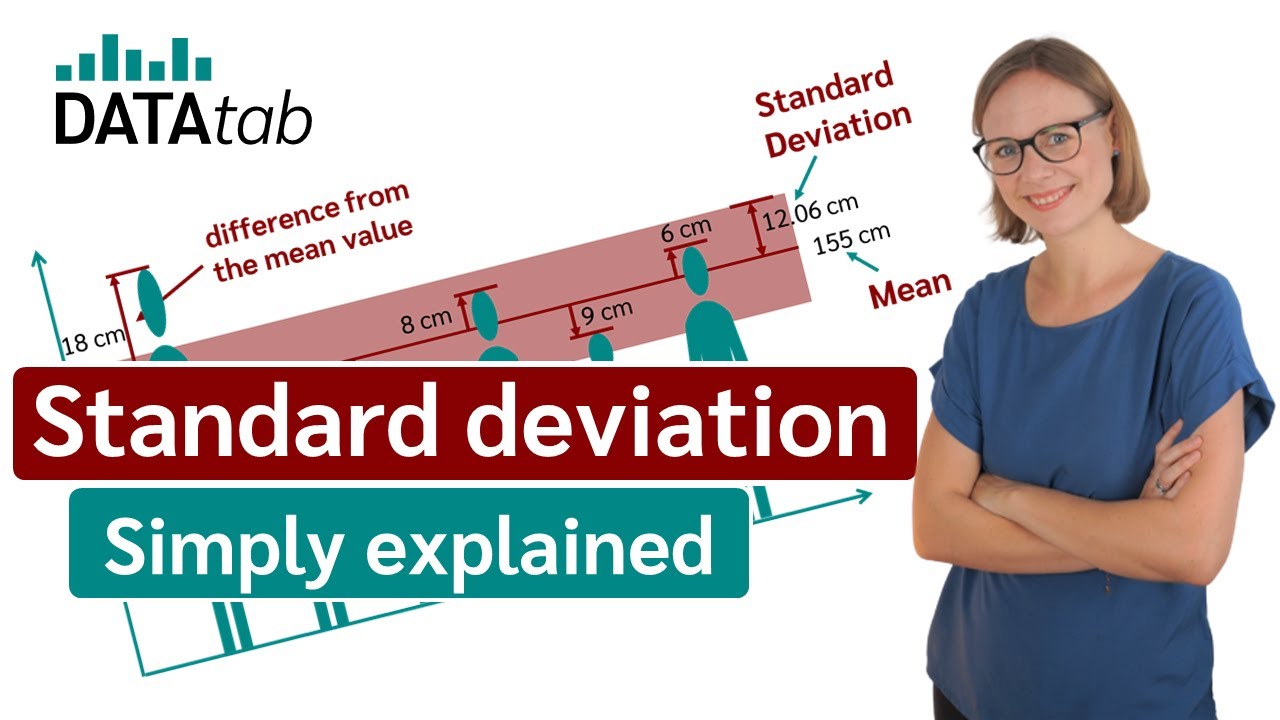
Standard deviation (simply explained)
dispersion
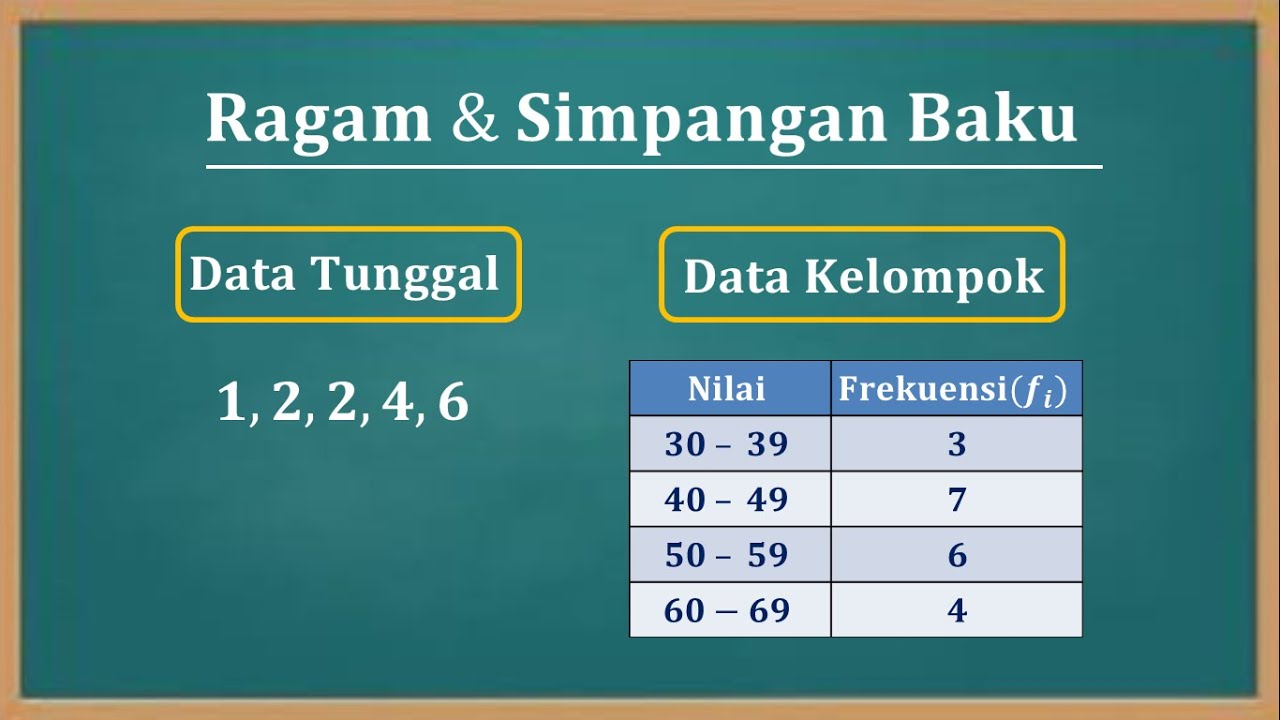
Cara menentukan nilai varian (Ragam) dan Standar deviasi (Simpangan baku) data tunggal dan kelompok
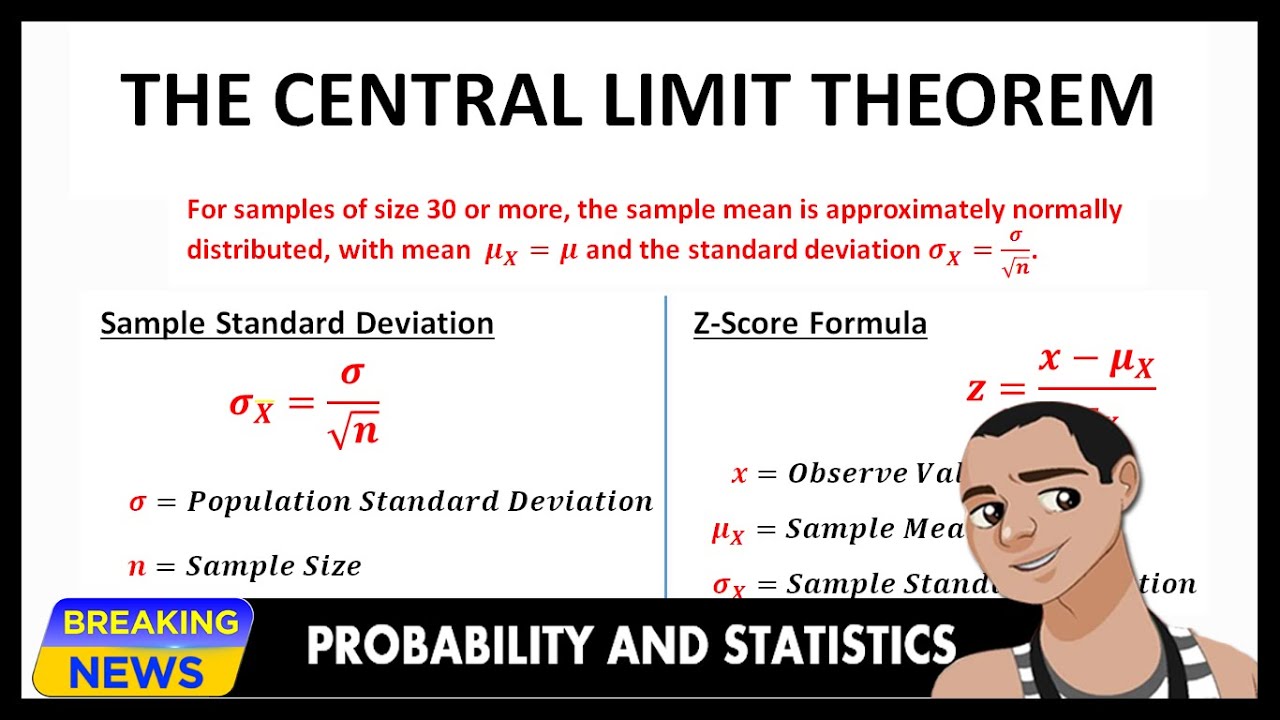
THE CENTRAL LIMIT THEOREM
Standard Error of the Mean: Concept and Formula | Statistics Tutorial #6 | MarinStatsLectures

MEASURES OF DISPERSION || MATHEMATICS IN THE MODERN WORLD
5.0 / 5 (0 votes)
