CARA MENENTUKAN MEAN MEDIAN MODUS DATA TUNGGAL||STATISTIKA
Summary
TLDRThis educational video script focuses on teaching the concepts of mean, median, and mode in single data statistics. It guides viewers through calculating these measures using examples with both odd and even data sets. The script emphasizes the importance of understanding these statistical measures and encourages viewers to engage with the content by liking, subscribing, and notifying for updates. The tutorial is designed to be informative and accessible, aiming to enhance the viewers' comprehension of basic statistical analysis.
Takeaways
- 📚 The video is an educational tutorial focusing on the concepts of mean, median, and mode in single data statistics.
- 🔢 The mean (average) is calculated by summing all data points and dividing by the number of data points.
- 📈 To find the median, data must be sorted in ascending order, and for even-numbered data sets, the middle two numbers are averaged.
- 📊 The mode is the value that appears most frequently in a data set, and there can be more than one mode if multiple values appear with the same highest frequency.
- 👩🏫 The tutorial provides a step-by-step guide on how to calculate each measure, starting with an explanation of the concepts.
- 📝 The presenter uses a real-life example of student grades to demonstrate the calculation of mean, median, and mode.
- 🧮 The calculation of the mean involves adding all the data points and then dividing by the total number of data points.
- 📋 The median calculation requires sorting the data and identifying the middle value(s), with specific instructions for both even and odd sets of data.
- 🔍 The mode is determined by identifying the most frequent number in the data set, with an example showing how to handle a tie between two modes.
- 💡 The video emphasizes the importance of understanding these statistical measures and provides clear instructions to ensure viewers can apply them to their own data sets.
- 📢 The presenter encourages engagement by prompting viewers to like, subscribe, and notify for new content, indicating the educational and interactive nature of the video.
Q & A
What are the three statistical measures discussed in the script?
-The three statistical measures discussed in the script are mean, median, and mode.
How is the mean calculated according to the script?
-The mean is calculated by summing all the data points and then dividing by the number of data points.
What is the median and how is it determined in the script?
-The median is the middle value of a data set when it is ordered from least to greatest. If the data set has an even number of values, the median is the average of the two middle numbers.
What is the mode and how is it identified in the script?
-The mode is the value that appears most frequently in a data set. It is identified by counting the frequency of each value and selecting the one that occurs most often.
What is the first step in determining the median according to the script?
-The first step in determining the median is to sort the data from the smallest to the largest value.
How does the script handle data sets with an even number of values when calculating the median?
-For data sets with an even number of values, the script instructs to find the two middle numbers and calculate their average to determine the median.
What is the mean of Dina's test scores as mentioned in the script?
-The mean of Dina's test scores is 7.8.
What is the median of Dina's test scores according to the script?
-The median of Dina's test scores is 8.
What is the mode of Dina's test scores as discussed in the script?
-The mode of Dina's test scores is 8.
How does the script handle data sets with an odd number of values when calculating the median?
-For data sets with an odd number of values, the script instructs to directly take the middle value as the median.
What is the mean of Balu's test scores as calculated in the script?
-The mean of Balu's test scores is 6.6.
What are the modes of Balu's test scores according to the script?
-The modes of Balu's test scores are 6 and 7.
Outlines

Dieser Bereich ist nur für Premium-Benutzer verfügbar. Bitte führen Sie ein Upgrade durch, um auf diesen Abschnitt zuzugreifen.
Upgrade durchführenMindmap

Dieser Bereich ist nur für Premium-Benutzer verfügbar. Bitte führen Sie ein Upgrade durch, um auf diesen Abschnitt zuzugreifen.
Upgrade durchführenKeywords

Dieser Bereich ist nur für Premium-Benutzer verfügbar. Bitte führen Sie ein Upgrade durch, um auf diesen Abschnitt zuzugreifen.
Upgrade durchführenHighlights

Dieser Bereich ist nur für Premium-Benutzer verfügbar. Bitte führen Sie ein Upgrade durch, um auf diesen Abschnitt zuzugreifen.
Upgrade durchführenTranscripts

Dieser Bereich ist nur für Premium-Benutzer verfügbar. Bitte führen Sie ein Upgrade durch, um auf diesen Abschnitt zuzugreifen.
Upgrade durchführenWeitere ähnliche Videos ansehen

Statistics: The average | Descriptive statistics | Probability and Statistics | Khan Academy
KULIAH STATISTIK (5) - UKURAN PEMUSATAN DATA
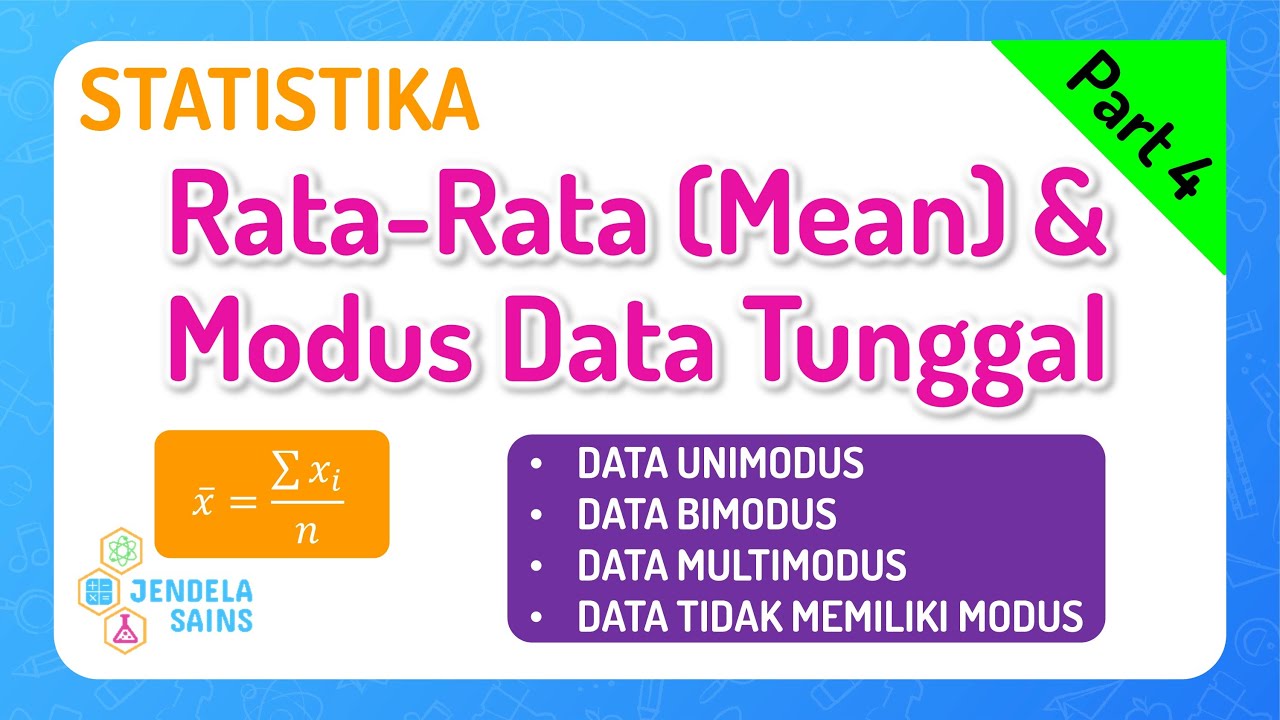
Statistika • Part 4: Ukuran Pemusatan Data Tunggal - Rata-Rata (Mean) dan Modus
Mean, Median, and Mode

STATISTIKA PART 4 (MEAN, MEDIAN, MODUS)
Ukuran pemusatan data, mean median modus, Statistika
5.0 / 5 (0 votes)
