How To Improve Day Trading Entries (Timeframe Alignment)

James Rich Young
23 Aug 202208:23

Summary

TLDRThis video script delves into the concept of multiple time frame analysis in trading, which significantly enhances the probability of successful trades. The speaker emphasizes the importance of aligning multiple time frames to identify trends and momentum, akin to betting on the winning team in a basketball game's final moments. They discuss using moving averages to quickly gauge trends and highlight the significance of waiting for time frame alignment before entering trades. The script provides practical examples of how to apply this strategy for both intraday and swing trades, illustrating how it can help traders avoid unnecessary risks and manage their trades more effectively.

Takeaways

  • 📈 Multiple Time Frame Analysis is a trading technique that involves analyzing charts on more than one time frame to increase the probability of successful trades.
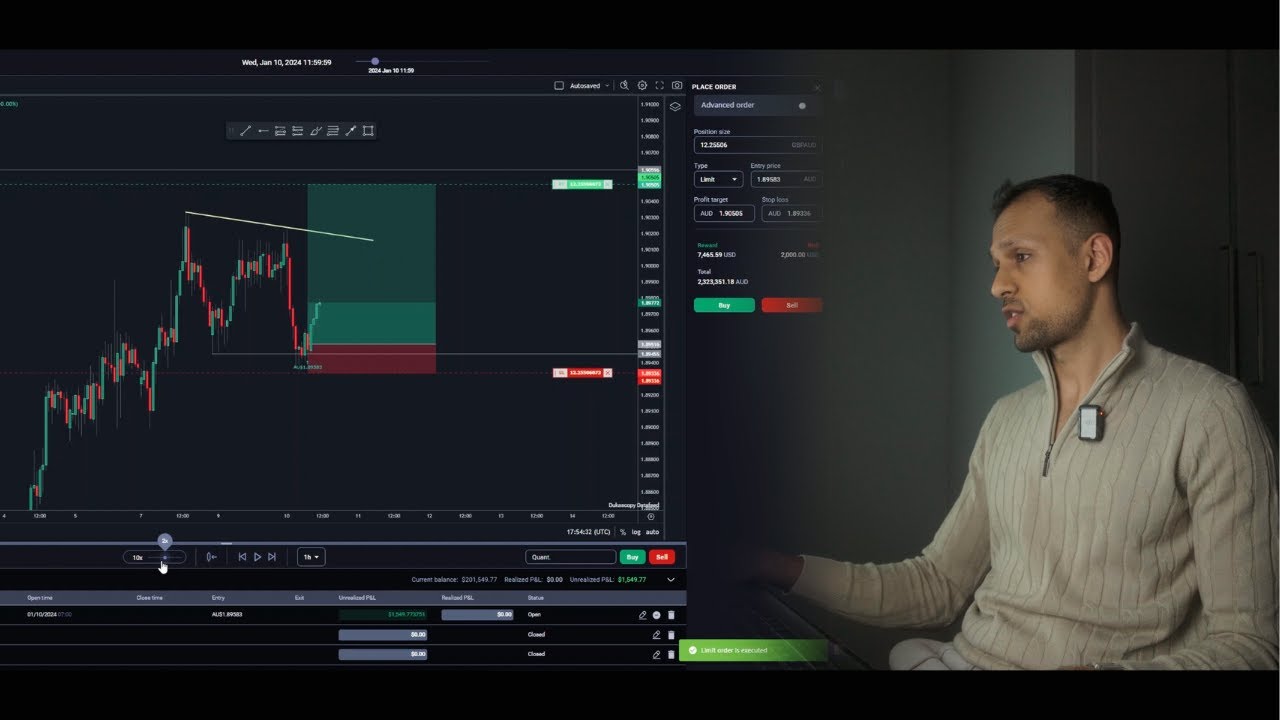
  • 🔍 Before entering a trade, the speaker checks both higher and lower time frames to ensure there's no conflict that could affect the trade negatively.
  • 🌟 The concept of 'time frame alignment' is crucial; the speaker looks for multiple time frames to all indicate the same directional bias for a stronger trade setup.
  • 🏊‍♂️ A common saying in trading is 'it's easier to swim with the current than against it,' which translates to trading with the trend rather than against it.
  • 📊 The speaker uses specific time frames for intraday trading (1, 2, 5, 15-minute, and hourly) and larger time frames (daily, weekly, monthly) for analyzing stocks.
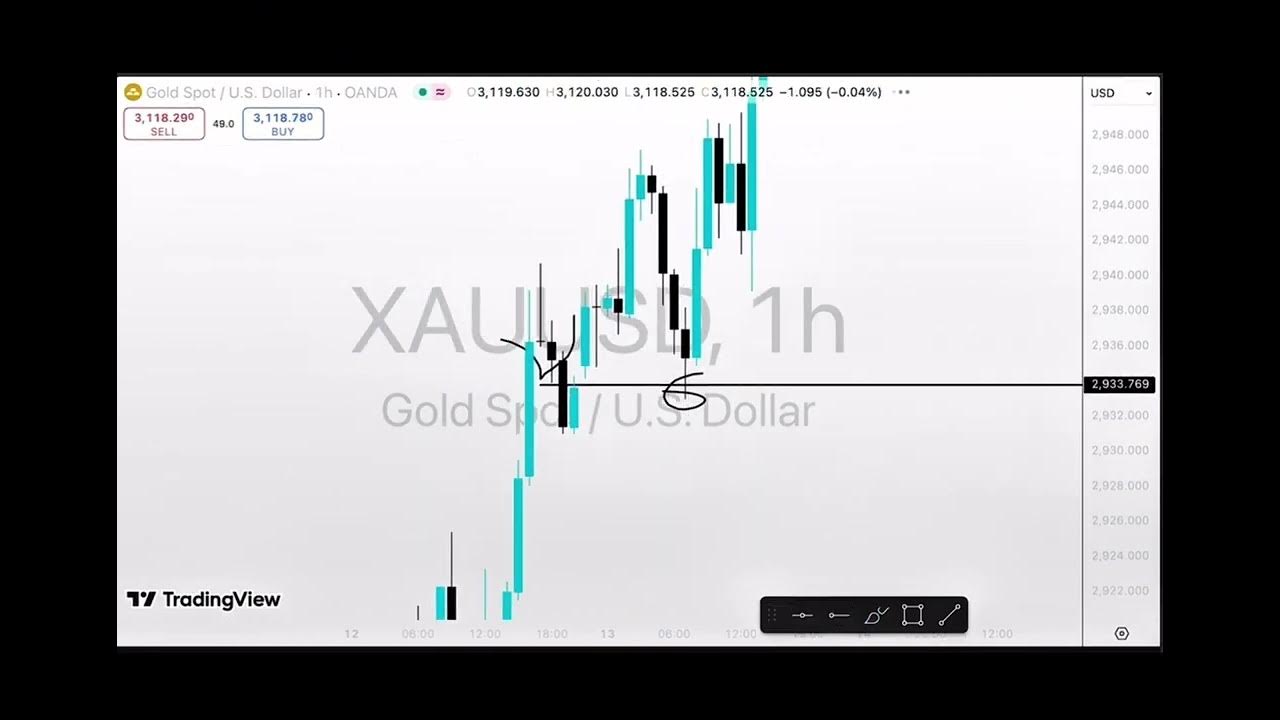
  • 🛠 The speaker relies on moving averages, particularly the 20-period and 200-period moving averages, to identify trends and time entries.
  • ⏰ Patience is key; the speaker waits for a secondary entry when time frames align, which can provide a better momentum and increase the chances of a successful trade.
  • 📉 The speaker avoids trades where there's a conflict between time frames, as it can lead to a 'tug of war' that may result in unnecessary losses.
  • ⏫ Time frame alignment aids in trade management by providing early signals if the trade starts to fail, allowing for better decision-making on when to exit or adjust positions.
  • 🚫 Despite time frame alignment, there are no guarantees in trading, and the speaker acknowledges that some trades may not work out even with a well-aligned setup.

Q & A

  • What is the main concept discussed in the video script?

    -The main concept discussed is 'multiple time frame analysis' in trading, which involves analyzing charts on more than one time frame to increase the probability of successful trades.

  • Why is multiple time frame analysis important in trading?

    -Multiple time frame analysis is important because it helps align trades with the momentum of the market, making it easier to 'swim with the current' rather than against it, thus increasing the likelihood of a profitable trade.

  • What does the speaker mean by 'time frame alignment'?

    -The speaker refers to 'time frame alignment' as the situation where multiple time frames all indicate the same directional bias, which provides more confirmation and momentum for a trade in that direction.

  • Which time frames does the speaker typically use for intraday trading?

    -The speaker uses the 1-minute, 2-minute, 5-minute, 15-minute, and hourly time frames for intraday trading.

  • How does the speaker use moving averages in their trading strategy?

    -The speaker uses the 20-period moving average (blue line) to quickly identify the trend direction and the 200-period moving average (orange line) for broader trend analysis. An uptrend is indicated when the 20-period moving average is moving upwards with candles trading above it, and a downtrend is indicated when the 20-period moving average is moving downwards with candles trading below it.

  • What is the significance of the 20-period moving average in the speaker's strategy?

    -The 20-period moving average is significant because it helps the speaker to quickly determine the current trend direction, which in turn influences the type of trading setups they look for and the timing of their entries.

  • Why does the speaker wait for a secondary entry in some cases?

    -The speaker waits for a secondary entry when there is a conflict between time frames, allowing the market to resolve the conflict and achieve time frame alignment before entering a trade, which can provide a better risk-reward setup.

  • How does time frame alignment help with trade management?

    -Time frame alignment helps with trade management by providing early signals of a trade's potential failure, allowing the trader to adjust their stop losses and manage their positions more effectively.

  • What does the speaker mean when they say 'let Mommy and Daddy fight it out'?

    -This is a metaphorical expression used by the speaker to describe waiting for conflicting time frames to resolve their differences before making a trade, ensuring that the trader enters a trade only when there is agreement among the time frames in the desired direction.

  • Why might the speaker pass on a trade even if there is a buy setup on a certain time frame?

    -The speaker might pass on a trade if there is a buy setup on a certain time frame but the lower time frame is in a conflicting downtrend, as this could indicate a tug of war between the time frames, leading to a higher risk of loss.

Outlines

00:00

📈 Multiple Time Frame Analysis in Trading

The speaker discusses the concept of multiple time frame analysis, which significantly improved their trading by increasing the probability of successful trades. They liken it to betting on the winning team in a basketball game's fourth quarter, emphasizing the importance of momentum. The speaker explains that this analysis involves looking at charts on more than one time frame to identify potential conflicts that could affect a trade. They focus on the idea of time frame alignment, where multiple charts should indicate the same direction for a stronger momentum. The speaker uses moving averages as indicators, with the 20-period moving average (blue line) helping to identify the trend direction. They provide examples of how waiting for time frame alignment can lead to better trading entries and how it can assist with trade management by providing early signals of a trade's potential failure.

05:00

🔄 Waiting for Time Frame Alignment

In this paragraph, the speaker further elaborates on the strategy of waiting for time frame alignment before entering a trade. They explain that even if a buy setup looks promising on a 15-minute chart, they will pass on the trade if the 5-minute chart indicates a conflicting downtrend. The speaker prefers to wait for a secondary entry that aligns with the direction they want to trade, which provides better momentum and reduces the risk of getting caught in a tug of war between conflicting time frames. They also mention that this approach helps with trade management, allowing for more informed decisions on whether to exit a trade early if the time frames start to show a downtrend. The speaker concludes by emphasizing the simplicity and effectiveness of this strategy, which has become an integral part of their trading approach.

Mindmap

Keywords

💡Multiple Time Frame Analysis

Multiple Time Frame Analysis is a trading strategy that involves examining and analyzing financial instruments across various time frames. It is a key concept in the video, as it is what the speaker credits for taking their trading to the next level. By looking at different time frames, traders can gain a more comprehensive view of market trends and potential conflicts that might affect their trades. In the script, the speaker uses this analysis to decide whether to enter a trade, ensuring that the direction of the price movement on one time frame is supported by other time frames.

💡Probability of Trades

The 'probability of trades' refers to the likelihood that a trade will be successful. The speaker in the video is focused on increasing this probability by using multiple time frame analysis. By aligning different time frames in the direction they wish to trade, they believe they can stack the odds in their favor, similar to betting on the winning team in a sports game. This concept is central to the video's message about improving trading decisions.

💡Momentum

Momentum in trading refers to the strength or velocity of a current price movement. The speaker uses the term to describe the increased likelihood of a trade's success when multiple time frames are aligned in the same direction. It implies a force that carries the price in a particular direction, making it easier to 'ride the wave' of the market. The video emphasizes the importance of aligning with this momentum rather than fighting against it.

💡Support and Resistance

Support and resistance are fundamental concepts in technical analysis. Support is a price level where an asset's price tends to find a floor, while resistance is a price level where the price tends to encounter a ceiling. In the video, the speaker mentions these as aspects of multiple time frame analysis, suggesting that understanding where these levels are across different time frames can help in making informed trading decisions.

💡Time Frame Alignment

Time Frame Alignment is a strategy where a trader looks for harmony across different time frames before entering a trade. The speaker in the video emphasizes the importance of having multiple charts showing the same directional bias to increase the trade's chances of success. It is a core theme of the video, where the speaker illustrates how waiting for alignment can provide a more favorable entry point.

💡Moving Averages

Moving averages are a widely used indicator in technical analysis that helps to smooth out price data and highlight trends. In the video, the speaker uses a 20-period moving average (blue line) and a 200-period moving average (orange line) to quickly identify the trend direction. The moving averages are instrumental in determining whether the market is in an uptrend or downtrend, which in turn influences the type of trading setups the speaker looks for.

💡Intraday Time Frames

Intraday Time Frames refer to the short-term time frames used by traders to make decisions within a single trading day. The speaker mentions using the one, two, five, and fifteen-minute charts for intraday trading. These time frames are crucial for day traders who need to make quick decisions based on short-term market movements.

💡Swing Trades

Swing trades are trades that are held for several days to several weeks, aiming to capture significant price movements. The video speaker discusses how they use different time frames for swing trades, such as the hourly, daily, weekly, and monthly charts, to ensure alignment before entering a position. This approach helps in managing risk and increasing the probability of success.

💡Trade Management

Trade management is the process of overseeing and adjusting open trades to maximize profits and minimize losses. In the context of the video, the speaker uses time frame alignment to improve trade management by providing early signals of a trade's potential failure. This allows for better decision-making on whether to hold, exit, or adjust the position based on the evolving market conditions across different time frames.

💡Secondary Entry

A secondary entry in trading refers to an opportunity to enter a trade after the initial signal has passed, often after a pause or retracement in the market. The speaker in the video waits for a secondary entry when time frames are aligned, which can provide a more favorable risk-reward setup. This strategy is highlighted as a way to avoid getting caught in conflicting market movements and to increase the chances of a successful trade.

Highlights

Multiple time frame analysis is key to increasing the probability of successful trades.

It's like betting on the winning team in the fourth quarter of a basketball game, with momentum on your side.

Multiple time frame analysis involves looking at and analyzing charts on more than one time frame.

Checking lower and higher time frames can reveal conflicts that may affect trade performance.

Time frame alignment is crucial; it means multiple charts should all indicate the same direction for a strong trade setup.

The saying 'it's easier to swim with the current than against it' applies to trading with the trend.

The speaker uses one, two, five, fifteen-minute, and hourly charts for intraday trading, and daily, weekly, and monthly for larger time frames.

For day trades, alignment of one, two, five, and fifteen-minute charts is preferred, and for swing trades, hourly, daily, weekly, and monthly.

Only moving averages are used as indicators, with the 20-period moving average indicating the trend direction.

A buy setup on a 15-minute chart is checked against the five-minute chart for time frame alignment.

Waiting for a secondary entry with time frame alignment can provide a better momentum for the trade.

Time frame alignment helps in trade management, allowing for early signals of a failing trade and the opportunity to cut losses.

Even with time frame alignment, there are no guarantees in trading, as markets can be unpredictable.

The speaker emphasizes the importance of always checking multiple time frames before trading.

The concept of time frame alignment is simple yet powerful, and it has become an integral part of the speaker's trading strategy.

The speaker invites viewers to like, comment, and subscribe for more content, highlighting the interactive nature of the trading community.

Transcripts

play00:00

so recently I had a great discussion

play00:01

about how I use multiple time frame

play00:03

analysis in my trading and I thought I'd

play00:05

share some of it here too because this

play00:07

concept is what took my trading to that

play00:09

next level and it immediately helped

play00:11

increase the probability of my trades

play00:13

following through it almost feels like I

play00:15

have the power to bet on the winning

play00:16

team in like a fourth quarter of a

play00:18

basketball game because I'm just getting

play00:19

much more momentum on my side to where

play00:21

price is heading now that doesn't

play00:23

necessarily mean it's a guaranteed win

play00:25

because we all saw Tracy McGrady hit 13

play00:27

points in the last 33 seconds to win the

play00:29

game so anything can happen especially

play00:32

with trading but increasing the

play00:34

probability is what I'm looking for so

play00:36

what is multiple time frame analysis it

play00:38

is looking at and analyzing charts on

play00:41

more than one time frame so let's say I

play00:42

come across a stock I'm looking to trade

play00:44

and it has a pretty buy set of pattern

play00:46

off of whatever time frame I'm looking

play00:48

at but before I do anything else I ask

play00:51

myself what is the lower and higher time

play00:54

frames also doing because even though

play00:56

it's a buy setup and looking higher on

play00:57

this time frame it may also be setting

play00:59

up a cell setup and looking lower on

play01:03

another time frame so there may be some

play01:04

conflict there that may cause my trade

play01:06

to struggle if I were to get into it now

play01:08

there's many aspects to analyzing

play01:10

multiple time frames like finding

play01:12

support and resistance trade management

play01:14

determining your targets but what I want

play01:16

to focus on in this video is looking for

play01:18

time frame alignment meaning if I want

play01:20

to play something long I want not just

play01:23

one chart but multiple charts to all

play01:25

look higher I want to see them all

play01:27

aligned with the direction I want to

play01:29

play because when I get multiple time

play01:30

frame alignment there's much more

play01:32

momentum in that direction there's more

play01:34

confirmation there's a common saying

play01:36

it's easier to swim with the current

play01:38

than against it which means it's easier

play01:40

to trade with the trend than against it

play01:42

so when I have not just one but multiple

play01:46

currents all pushing into One Direction

play01:49

it just makes it that much stronger when

play01:51

you think about it it seems like such a

play01:53

simple and effective concept but it's

play01:55

something that is often overlooked so

play01:57

then the next question is what time

play01:58

frames do I look at if you watched any

play02:01

of my live training videos you know I

play02:03

use the one two five fifteen minute and

play02:05

the hourly for my intraday time frames

play02:07

but I also have the daily weekly monthly

play02:10

for my larger time frames so anytime I

play02:12

pull up a stock those are the only eight

play02:15

time frames I'm looking at and analyzing

play02:17

before I take any trades now I'm not

play02:19

looking for alignment on all eight of

play02:21

them but for my day trades I like to see

play02:23

the one two five fifteen minute aligned

play02:26

and for my swing trades the hourly daily

play02:28

weekly and monthly aligned so let's get

play02:31

into some real examples so first notice

play02:33

on my charts that the only indicators I

play02:36

use is the moving averages the blue line

play02:38

is the 20 period moving average and the

play02:40

orange line is the 200 I'll definitely

play02:42

make an in-depth video on how I use them

play02:45

but one of the ways I use the 20ma is to

play02:48

quickly identify the trend if the blue

play02:50

line is moving upwards with candles

play02:52

trading above it it's in an uptrend

play02:54

which is when I focus on buying

play02:56

opportunities and if the blue line is

play02:58

moving downwards with candles trading

play03:01

under it it's on a downtrend where I

play03:03

focus on shorting opportunities it helps

play03:06

to know what setups I look for which

play03:07

I'll link on the screen right now if you

play03:09

want to check it out so here I have a

play03:11

buy setup of the 15 minute I see a nice

play03:14

pop from this morning with a clean

play03:16

pullback into the rising 20ma which I

play03:18

also use to time my entries but before I

play03:21

jump into this trade I want to check on

play03:23

my other time frames to make sure that

play03:25

they're aligned with the direction I

play03:27

want to play which in this case is for

play03:29

the price to move higher again I use the

play03:31

one two five fifteen minute for my

play03:33

intraday also have the hourly on there

play03:36

but let's focus on these for now and

play03:38

have a look so usually I just need to

play03:40

look at the one time frame lower because

play03:43

if that is aligned it will mean even the

play03:45

smaller time frames under that should be

play03:47

aligned as well or if it's not then

play03:50

there's no trade for me anyway yet at

play03:52

least so for that reason and also to

play03:55

make it easier to follow along let's

play03:57

focus on the time frame I'm trading and

play03:59

the one time frame underneath that in

play04:02

this case we can see that the one time

play04:03

frame lower the five minute is actually

play04:06

in a downtrend right the 20ma pointing

play04:09

down with candles trading under it so we

play04:12

do not have time frame alignment and no

play04:14

matter how clean this 15 minute buy

play04:16

setup is there's going to be a bit of a

play04:19

fight coming from the five minute

play04:20

downtrend and that's a problem for me

play04:22

because if I get triggered in on this

play04:24

buy setup and the five minute downtrend

play04:27

decides to follow through and continue

play04:29

then I'm going to take a loss now that

play04:32

doesn't mean I should completely pass on

play04:34

this trade it just means it's not ready

play04:36

yet so what I like to wait for is to see

play04:39

if that five minute downtrend fails so I

play04:42

let that first meta buy setup go and now

play04:44

I see that the five minute is ending the

play04:46

downtrend and transitioning into an

play04:49

uptrend the 20ma is starting to curl up

play04:51

with the candles trading and holding

play04:53

above it and I can see that the momentum

play04:55

is Shifting to the upside so by just

play04:58

waiting for that secondary entry tree

play05:00

waiting for my time frames to get

play05:02

aligned gives me an entry with better

play05:04

momentum in the direction I'm trading

play05:06

and off it goes here's another 15 minute

play05:09

buy setup but before I do anything let's

play05:11

take a look at the one time frame blower

play05:13

on the five minute and it looks like we

play05:15

have the same situation here I see that

play05:18

we have a declining 20 with candles

play05:20

trading under it so again I'm gonna pass

play05:22

on this initial buy setup because if it

play05:25

triggers I don't want to sit through

play05:27

this tug of war that's going to happen

play05:29

between these two time frames and make

play05:31

me sweat through this trade before it

play05:34

decides which direction it wants to go

play05:36

I'd rather just wait for more

play05:38

confirmation skip through this chop and

play05:41

see if that five minute downtrend can

play05:43

fix itself first and get in on this

play05:45

secondary entry when I have time frame

play05:47

alignment on my side and look at the

play05:50

move it makes once we have time frame

play05:52

alignment now sometimes they don't give

play05:54

a secondary entry and just work right

play05:56

away and go without me which I'm okay

play05:59

with because a lot of times they don't

play06:01

work either so if we look here on this

play06:03

15 minute cell setup that's triggering

play06:06

while the five minute is on an uptrend

play06:07

this time the five minute is the

play06:10

dominant one and continues to move

play06:12

higher which would have stopped me out

play06:14

so this keeps me out of trouble and

play06:16

avoids unnecessary chop pests it also

play06:19

helps with my management if I decide to

play06:22

do this 15 minute buy setup while the 5

play06:25

minute is in Conflict I can't do

play06:27

anything but leave my stop at the pivot

play06:29

and hope that the five minute fails the

play06:32

downtrend whereas if I wait for another

play06:34

entry where my time frame is aligned I

play06:37

have a better idea if the trade doesn't

play06:39

look good anymore I can get early

play06:41

signals of the trade failing and can

play06:43

raise my stop and cut my losses by

play06:46

noticing if the other time frames start

play06:48

to go on the downtrend again keep in

play06:51

mind just because we have time frame

play06:52

alignment doesn't guarantee it'll work

play06:54

right let's look at one more here's a 15

play06:57

minute cell setup with the 5 minute

play06:59

being a bit too strong and turning into

play07:01

an uptrend so I'm going to wait and let

play07:03

it go and now I see a buy setup has

play07:06

formed and triggered on the smaller time

play07:09

frame so actually now I don't even

play07:11

really need to wait for this to turn

play07:13

into a downtrend I can actually put my

play07:16

order in under this tail because if it

play07:18

triggers it means that the five minute

play07:21

buy setup failed and will turn into a

play07:24

downtrend giving me the time frame

play07:26

alignment in this case it took a bit of

play07:28

time before triggering also given a one

play07:31

two three but look at how trades tend to

play07:33

flow in its direction a lot better when

play07:36

I have time frame alignment so hope this

play07:39

is making sense it's such a simple and

play07:41

Powerful tool to have in my trading it's

play07:43

engraved in me now to always check

play07:45

multiple time frames if I see conflict I

play07:48

let Mommy and Daddy fight it out until

play07:50

they are in agreement in harmony with

play07:53

the direction I want to trade and go

play07:55

from there alright if you found this to

play07:57

be helpful all I ask is that you take a

play07:59

second of your time to like the video

play08:01

leave a comment feel free to ask

play08:03

questions subscribe if you want more

play08:05

content like this one as always I

play08:08

appreciate you for being here and I hope

play08:09

to see you on the next one

play08:11

[Music]

play08:20

[Applause]

Rate This

5.0 / 5 (0 votes)

Ähnliche Tags
Trading StrategiesTime Frame AnalysisMarket MomentumStock TradingTrading TipsTechnical AnalysisSupport & ResistanceTrade ManagementMoving AveragesMarket Trends
Benötigen Sie eine Zusammenfassung auf Englisch?