Intraday Bias Simplified | ICT 2022 Mentorship + MMXM = 🤯

Zeussy
19 Sept 202213:27

Summary

TLDRIn this educational trading video, Zeus explains the concept of market maker models and their significance in determining trade biases. He emphasizes the fractal nature of price movements and how they manifest across different time frames. By analyzing higher time frame institutional order flows and identifying entry patterns on lower time frames, traders can align with market trends, increasing the probability of successful trades. Zeus provides real-world examples and encourages viewers to study and backtest these models for deeper understanding.

Takeaways

  • 😎 The video by Zeus explains how to determine a trading bias using market maker models.
  • 📈 Price is fractal, meaning patterns observed on higher time frames can also be seen on lower time frames.
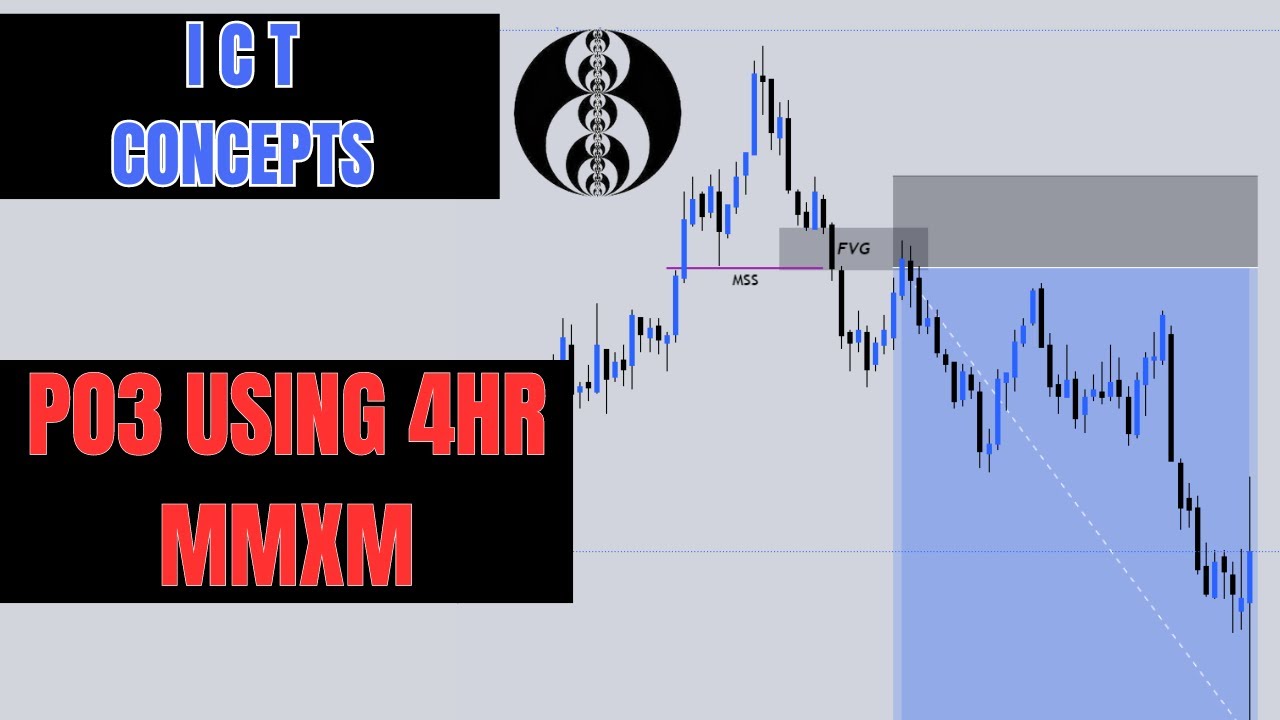
  • 📊 The market maker cell model involves the market trading up to a key premium area and then reversing, which is a common pattern.
  • 🤔 Retail traders often place stop losses based on support and resistance levels, which smart money traders can anticipate and use to their advantage.
  • 💡 Market makers move to areas of liquidity to fulfill orders, which smart money traders watch for to identify potential reversals.
  • 🔍 Zeus demonstrates how to spot market maker models by using chart examples and the theory behind why they work.
  • 📝 Trading in line with the higher time frame bias increases the probability of successful trades.
  • 📉 The NASDAQ example shows how a market maker cell model can be identified on different time frames, from one hour to one minute.
  • 🛠️ Fractals within fractals concept allows traders to identify market maker models on various time frames, using the larger patterns as points of interest for smaller time frame entries.
  • 🎯 Zeus emphasizes the importance of combining the market maker model framework with the logic of market liquidity movements for high-probability setups.
  • 📚 The video encourages viewers to study and backtest market maker models to understand their occurrence in the market.

Q & A

  • What is the main focus of Zeus's video?

    -The main focus of Zeus's video is to explain how he determines a trading bias by incorporating market maker models into his analysis.

  • Why is it necessary to have a framework for market expectations?

    -A framework is necessary because it provides the logic behind why the markets should behave as expected, giving a structured approach to trading.

  • What does Zeus mean when he says 'price is fractal'?

    -When Zeus says 'price is fractal,' he means that market patterns observed on higher time frames can also be seen on lower time frames.

  • What is the significance of the market maker cell model created by ICT?

    -The market maker cell model created by ICT is significant because it helps traders understand how the market trades into key areas and then reverses, which can be used to predict future market movements.

  • Why does the market maker model keep repeating itself?

    -The market maker model repeats itself because it is based on the consistent behavior of market participants, particularly retail and smart money, in response to price movements and perceived support/resistance levels.

  • How does the smart money trader view the market's movement into areas of liquidity?

    -Smart money traders view the market's movement into areas of liquidity as an opportunity to fulfill their orders, rather than as a sign that the market will continue to move in the same direction.

  • What is the importance of trading in line with the higher time frame bias?

    -Trading in line with the higher time frame bias increases the probability of successful trades, as it aligns with the overall market direction and institutional order flow.

  • How does Zeus use the one hour chart of the NASDAQ as an example in his explanation?

    -Zeus uses the one hour chart of the NASDAQ to demonstrate how a market maker cell model can be identified, showing how the market trades into a fair value gap and then respects it as a sell-side inefficiency.

  • What is the role of the fair value gap in the market maker cell model?

    -The fair value gap in the market maker cell model serves as an area of price consolidation and potential reversal, indicating where smart money may enter or exit the market.

  • How does the fractal nature of price help in identifying market maker models across different time frames?

    -The fractal nature of price allows traders to identify similar market maker models across different time frames, from one hour to five minutes, providing multiple opportunities to trade based on the same underlying logic.

  • What advice does Zeus give regarding trading against the trend?

    -Zeus advises that trading against the trend, such as looking for market maker buy models within a bearish institutional order flow, requires a lot of experience and knowledge and suggests that beginners should stick to trading in line with the higher time frame flow.

  • What is the importance of combining the market maker model with the framework of institutional order flow?

    -Combining the market maker model with the framework of institutional order flow increases the likelihood of making correct trading decisions, as it aligns with the overall market sentiment and the actions of large players in the market.

  • How does Zeus demonstrate the application of the market maker model in a real trade example?

    -Zeus demonstrates the application of the market maker model in a real trade example by showing how he identified a market maker buy model on the one hour chart, verified it on the five minute chart, and then executed the trade with a stop loss and target based on the identified patterns.

Outlines

00:00

📈 Introduction to Market Maker Models in Trading

Zeus introduces the concept of using market maker models to determine trade biases. He emphasizes the importance of a logical framework for market expectations and explains how market makers' behavior influences price patterns. The video promises to demonstrate the fractal nature of price movements across different time frames and how understanding these patterns can reveal opportunities for traders. Zeus also mentions the significance of smart money and retail traders' perceptions in forming market bias.

05:01

📉 Market Maker Models and High Probability Trading

This paragraph delves into the specifics of market maker models, explaining how retail traders' stop-loss placements and smart money's strategic moves create predictable market patterns. It discusses the importance of aligning trades with the higher time frame bias and using market maker models on lower time frames for high probability setups. Zeus provides a real-world example from the NASDAQ, illustrating how to identify and trade according to the market maker cell model within various time frames, from one hour down to one minute.

10:03

🔍 Fractals in Market Maker Models and a Trade Example

Zeus explains the concept of fractals within market maker models, showing how larger patterns can contain smaller, similar patterns across different time frames. He uses the five-minute and one-minute charts to highlight how points of interest from larger time frames can guide entry points on smaller ones. The paragraph concludes with a detailed trade example from September 7th, where Zeus applied the market maker buy model, providing a step-by-step account of his analysis and the resulting trade outcome.

Mindmap

Keywords

💡Bias

In the context of trading, 'bias' refers to a trader's preconceived notion or inclination towards a particular direction in the market, typically based on analysis and patterns. The video's theme revolves around developing a trading bias by using market maker models. For instance, the script mentions 'how I come up with a bias for my trades' and explains the importance of having a logical framework for market expectations.

💡Market Maker Models

These models are theoretical constructs used by traders to understand and predict market movements based on the behavior of market makers. The video discusses how incorporating these models into analysis can help in identifying high-probability trading setups. An example from the script is the 'market maker sell model' which is used to illustrate how the market trades into key areas and then reverses.

💡Fractal

The term 'fractal' in trading signifies that price patterns repeat across different time frames. The video emphasizes that understanding fractals can help traders identify similar patterns on higher and lower time frames. The script uses the concept to explain how observing patterns on a five-minute chart can be as insightful as on a daily chart.

💡Support and Resistance

Support and resistance are concepts used to identify price levels at which it is expected that the market will find a pause in its movement. In the script, retail traders are described as placing their stop losses below support levels, expecting the market to continue moving higher.

💡Smart Money

Smart money refers to large institutional investors or professional traders who are believed to have a more significant impact on the market. The video suggests that understanding smart money's behavior is crucial for identifying market maker models. For example, the script mentions 'smart money reversal' as a key moment in the market maker model.

💡Liquidity

Liquidity in trading refers to the ease with which assets can be bought or sold without affecting their price. The script explains that market makers move the market to areas of liquidity to fulfill orders of smart money, which is a critical aspect of the market maker models discussed in the video.

💡Fair Value Gap

A 'fair value gap' is a term used to describe a price area that the market is expected to reach based on its current trading behavior. The video uses this term to illustrate how traders can identify potential reversal points in the market. The script mentions 'fair value gap' in the context of market trading patterns and entry points for trades.

💡Order Block

An 'order block' is a price area where there is a high concentration of buy or sell orders. In the script, the concept is used to explain how the market's movement is influenced by these areas of concentrated orders, which are crucial for the execution of smart money strategies.

💡Stop Loss

A 'stop loss' is an order placed by a trader to sell a security when it reaches a certain price, typically to limit potential losses. The video discusses how retail traders place their stop losses based on support and resistance levels, which is a behavior that can be exploited by understanding market maker models.

💡High Probability Setups

High probability setups refer to trading opportunities that have a higher chance of success based on certain patterns or signals. The video emphasizes the importance of aligning trades with the higher time frame bias to increase the probability of a successful trade. The script provides examples of how to identify these setups using market maker models.

💡Trendline

A 'trendline' is a line drawn on a chart to represent the direction of a price trend. The video uses trendlines to illustrate how market movements can be analyzed and to identify potential reversal points within the market maker models. The script mentions 'trendline impurity' as part of the entry pattern recognition process.

Highlights

Zeus introduces a framework for determining a trading bias based on market maker models.

The concept of price being fractal is explained, meaning patterns repeat across different time frames.

ICD's tweet about treating higher time frames as daily charts and studying lower time frames for new insights is referenced.

The logic behind market maker models is discussed, emphasizing the importance of retail and smart money behavior.

A step-by-step breakdown of the market maker sell model is provided, illustrating smart money reversals and entry patterns.

The importance of trading in line with higher time frame bias for high probability setups is highlighted.

An example of a market maker cell model on the NASDAQ one-hour chart is analyzed, showing institutional order flow.

The use of fractals within fractals is explained, demonstrating how patterns can appear on multiple time frames.

A detailed walk-through of a trade example from September 7th is presented, showing the application of market maker models.

The significance of using one-hour and five-minute premium arrays as points of interest for trade entries is discussed.

The video emphasizes combining the framework with the logic of market movement to trading areas of liquidity.

Zeus shares a personal trade example, detailing the thought process and strategy behind it.

The video concludes with a reminder to back-test market maker models for a deeper understanding of their effectiveness.

A call to action for viewers to engage with the content by liking, commenting, and applying the knowledge shared.

The video includes a link to ICT's videos for further exploration of market maker models.

The importance of aligning with the institutional order flow on higher time frames for successful trading is reiterated.

Transcripts

play00:03

hey guys it's me Zeus and today's video

play00:06

I'm going to explain to you guys how I

play00:09

come up with a bias for my trades the

play00:12

thing is with determining a bias is that

play00:15

you need to have a framework for why the

play00:18

markets should do what you expected to

play00:21

do

play00:22

there needs to be logic behind it and

play00:25

today's video I'm going to tell you guys

play00:28

how I incorporate the market maker

play00:31

models into my analysis about the

play00:34

marketplace

play00:35

and I'm going to share with you some

play00:38

chart examples some Trace that I took

play00:41

I'm going to share with you the theory

play00:44

about why the market maker models work

play00:48

and how you can spot them easily

play00:52

so let's dive into today's video

play00:58

[Music]

play01:03

I want to make something clear to you

play01:05

and that is that price is fractal

play01:08

and what that means is that what happens

play01:10

on the higher time frames happens on the

play01:14

lower time frames

play01:16

there's a reason why ICD sets in one of

play01:20

his tweets that if we treat the four

play01:24

hour or the 60 Minutes as our daily

play01:27

chart and study the five minute

play01:29

structure that the new worlds will open

play01:32

for us

play01:34

there's actually logic behind that and

play01:38

it all has to do with the market maker

play01:40

models and today I'm going to prove that

play01:42

to you

play01:43

I hope you will enjoy it

play01:46

so here's the market maker cell model

play01:48

created by ICT which is shared in one of

play01:51

his public YouTube videos

play01:54

we can see that the market trades up

play01:57

into a key premium array an order book

play02:02

or Fair fairy Gap or an old High

play02:06

and then the market refers

play02:09

and it's together's lower prices

play02:13

but why

play02:14

does this pattern work why does it occur

play02:18

why does this model keep repeating

play02:20

itself well let's look at it purely from

play02:23

an equality perspective

play02:25

the market has been trading up

play02:30

like this

play02:31

what do you think retail beliefs what

play02:35

the next move of the marketplace is

play02:37

likely to be

play02:39

reads or beliefs that the market is

play02:42

going to continue

play02:44

to move higher

play02:46

so where do they Place their stop losses

play02:49

below this row

play02:51

we go this row

play02:54

and especially these rows down here

play02:56

because retail thinks in terms of

play03:00

support and resistance

play03:02

so this becomes support

play03:05

this is support

play03:07

because the Markets started to move

play03:09

higher here we as smart money-minded

play03:12

Traders know

play03:14

that's the markers moves to areas of

play03:18

liquidity and that liquidity is needed

play03:21

in order to fulfill the orders of smart

play03:23

money

play03:24

so if the market is trading higher

play03:28

higher higher we do not look at that as

play03:31

oh the market is going to continue to go

play03:35

higher let's look for launch no we wait

play03:38

for the smart money refers to to take

play03:41

place within that premium array

play03:44

and then waits for an entry pattern to

play03:47

occur to provide us with the opportunity

play03:49

to Target these rows okay so here's the

play03:53

market make a buy model just refers to

play03:55

logic of the market makes cell model and

play03:57

you'll be all right here's a quick

play03:58

breakdown we wait for the marker to

play04:01

trade into an old discount array

play04:05

so this could be a fair failure gap an

play04:07

order book or an old row

play04:09

that would be here

play04:11

then we want to see the market reverse

play04:13

this is smart money reversal you could

play04:16

either be a buyer down here in smart

play04:18

manure first you could be a buyer here

play04:19

buyer here Target these highs

play04:24

why well Rito ceases as resistance so

play04:27

where do they place our stops the places

play04:28

stops above here and above here

play04:31

what I want you to keep in mind is that

play04:33

because price is factual you could use a

play04:36

one hour discount array so one hour Fair

play04:39

Ferry Gap and zoom into the lower time

play04:41

frames such as on the five minute time

play04:44

frame and see if there's a market make a

play04:47

buy model if price trades into that one

play04:49

hour Fair fire gap the same logic

play04:51

applies to the four hour time frame if

play04:53

you see the market rate into a four hour

play04:55

discount array you can go into the lower

play04:58

time frames to see if there's a market

play05:00

make buy model on the lower Tower frames

play05:03

but keep in mind if you want to have

play05:06

high probability setups you need to

play05:09

trade in line with the higher time frame

play05:11

bias so if you see a market make cell

play05:14

model on for example the daily

play05:16

just like there's on the s p and NASDAQ

play05:20

right now you want to be looking for

play05:22

Mark make cell models on the lower time

play05:25

frames because that's easiest training

play05:27

in line with the higher time frame or

play05:30

the flow

play05:31

of course you could go to counter Trends

play05:33

and look for Mark maker buy models

play05:35

within a market make cell model on the

play05:37

hard time frame

play05:39

but that takes a lot of experience and

play05:42

knowledge in order to pull that off I

play05:44

would just suggest to trade in line with

play05:47

the higher time frame institutional

play05:49

Ortho if you spot a

play05:51

higher time frame bearish institutional

play05:54

orderful you search for Market maker

play05:56

cell models if you spot a higher time

play05:58

frame bullish or the flow you look for

play06:00

Mark maker buy models

play06:02

keep that in mind

play06:06

so let's do what ICT set that we should

play06:08

do

play06:09

I have put on the one hour chart of the

play06:13

NASDAQ from last week's Trading

play06:17

and we can clearly see that there is a

play06:19

market make cell model here

play06:22

we have an original consolidation down

play06:25

here the Mark has been trading up

play06:28

into an old row

play06:30

into ffi Gap and on the CPI news release

play06:35

the market sold off then

play06:38

the next day we have a consolidation and

play06:41

then Thursday comes around

play06:44

we can see that this Fair failure Gap is

play06:46

holding price so this signals to us okay

play06:49

the market isn't in a mood to retrace

play06:52

higher before dropping lower no it's in

play06:55

a rush to take out these rows because

play06:58

this Fair fire gap this sell side

play07:01

inefficiency is being respected

play07:04

perfectly

play07:05

and there's an smt with the SMP

play07:09

we could look into the 15-minute charts

play07:13

because we already knew that the one

play07:15

hour charts institutional order flow was

play07:18

bearish because it was in a rush to take

play07:20

out these rows so now we have framed the

play07:24

bias

play07:26

for the day and now we can look on the

play07:29

lower time frames for entry patterns

play07:33

so here's the 15 minute chart this is at

play07:36

one hour for a fair fire gap and there's

play07:38

an smt here with the SMP

play07:40

we can see that the markets retraces

play07:44

into 50 minutes fair value Gap

play07:48

after leaving behind relatively egross

play07:52

remember those lows that are showed to

play07:56

you on the one hour chart those are

play07:58

these goes if we dive into the five

play08:00

minute time frame we can see the same

play08:02

thing appear the market trades into a 50

play08:07

minute

play08:08

Fair photo Gap

play08:11

and then it sells off for the PM session

play08:13

to complete the market make Excel model

play08:15

because there there was a lot of cell

play08:17

certificate down here trendline accuracy

play08:20

we have the one hour charts our higher

play08:24

time frame signaling to us that the

play08:27

institutional order flow is bearish

play08:29

the 15-minute chart is signaling to us

play08:32

that the institutional order flow is

play08:35

bearish a five minute chart structure

play08:38

shows us a clear Market maker cell model

play08:41

and now we just need to go on the one

play08:43

minute chart to fine-tune or take our

play08:46

entry is that the market was

play08:49

consolidating in here remember this is

play08:52

that original consolidation on the five

play08:53

minute chart we had the smart money

play08:55

refers to up here within that 15 minute

play08:58

fair value Gap

play08:59

and we started to see the markets break

play09:01

down fair value Gap get respected

play09:06

sales off

play09:08

retraces sells off although gets

play09:12

respected why does it get respected

play09:14

because of this fair value Gap

play09:17

was here a rejection block buysite has

play09:20

been taken Market struct shift retrace

play09:22

into a bearish order block stop can be

play09:25

placed above this high

play09:27

sells off what I want you to see is that

play09:30

within this Mark make cell model

play09:33

there was actually a market Mega cell

play09:35

model in one minute chart because here

play09:37

you can see trendline impurity being

play09:39

built up prices consolidating within in

play09:41

here the markets expands to an old

play09:45

premium array

play09:46

to an old row smart money refers for

play09:49

takes place rejection block Market

play09:52

structure shift retrace into bearish

play09:54

order block sells off completing the

play09:56

higher Target framework make Excel model

play09:58

and as well with our trade market make

play10:00

model so what I want you to understand

play10:02

is that fractals appear within fractals

play10:06

so we could see a one hour Market maker

play10:09

cell model

play10:10

but within that market make a cell model

play10:12

we could see a market maker cell model

play10:15

appear on the five minute chart

play10:18

and if we see that we can go into the

play10:21

one minute chart and look for the same

play10:22

stuff but what we can do is use our five

play10:25

minute premium arrays as point of

play10:28

interest

play10:29

for our One Minute Market maker cell

play10:32

model entries

play10:34

are price patterns

play10:37

so what we're doing is we're using the

play10:39

framework and combining that with the

play10:41

logic that the market moves to the

play10:43

obvious areas of liquidity

play10:45

and because we're trading in line with

play10:48

the higher time frame institutional

play10:49

order flow the probabilities of being

play10:51

right go through the roof

play10:54

and I hope that you are able to see the

play10:57

logic of that what I've just described

play10:59

in here

play11:01

so here's an example of a market maker

play11:03

buy model trait that I took this was on

play11:06

the 7th of September so at the beginning

play11:08

of this month so we can see that the

play11:10

market traded into this old fair value

play11:13

Gap here

play11:14

which was my poi

play11:17

on the one hour chart I saw that price

play11:19

trade into an order book here

play11:22

after price traded away from this four

play11:27

hour poi

play11:28

then I went into the five minute chart

play11:30

and I saw that probably straight into

play11:33

this one hour order book then a five

play11:35

minute order block got created price

play11:38

respect this we saw an original

play11:40

consolidation up here which was really

play11:42

obvious

play11:44

there's a lot of buyers at the equity

play11:46

above here Rito thinks oh this is

play11:48

resistance

play11:49

let's place our stop losses above these

play11:52

highs Trend wearing equality so this was

play11:55

a smart money reversal in my opinion

play11:59

but this is not enough information or

play12:01

confirmation for me I need to wait

play12:04

so I waited and waited and I saw that

play12:07

this five minutes verify get got

play12:09

respected price broke this intermediate

play12:12

term High here which was my significant

play12:15

microstructive shifts

play12:17

and then I went wrong within the sharify

play12:19

Gap stop above below this row because

play12:22

this row already rebalanced this fair

play12:25

for the Gap so this row should not be

play12:27

broken

play12:28

and then my targets were these highs

play12:31

over here

play12:32

here's the result of the trade

play12:37

so that basically sums up this video I

play12:39

hope I was able to point you into the

play12:41

right direction with regards to Market

play12:43

maker models I will leave a link to the

play12:45

videos of ICT in which he talks about

play12:48

Market maker models because this video

play12:51

alone will not make you fully grasp the

play12:54

market maker models probably I pointed

play12:57

you in the right direction and now it's

play12:58

up to you to put in the work and back

play13:00

test if they really occur within the

play13:03

marketplace

play13:04

I thank you all for watching if you

play13:06

enjoyed it or if you learned something

play13:08

new please leave a like or comment I

play13:11

would highly appreciate that and I wish

play13:13

you all a great day be safe

play13:20

[Music]

Rate This

5.0 / 5 (0 votes)

Related Tags
Market AnalysisTrading BiasFractal PriceLiquidity ZonesOrder FlowSmart MoneyRetail TraderTechnical AnalysisTrading StrategyMarket Maker