Simplifying Key Order Blocks in Forex Trading
Summary
TLDRIn this video, the concept of order blocks in financial markets is simplified for traders. It explains the conditions required for valid order blocks, how to identify and mark them on charts, and how they interact with market structure concepts. The video also covers key factors like inefficiency, liquidity, and break of market structure. Using order blocks along with top-down analysis across multiple time frames can improve trading strategies. Viewers learn about various liquidity grab patterns and how to incorporate tools like ATR for better trade execution. The video offers valuable insights into enhancing trading effectiveness and decision-making.
Takeaways
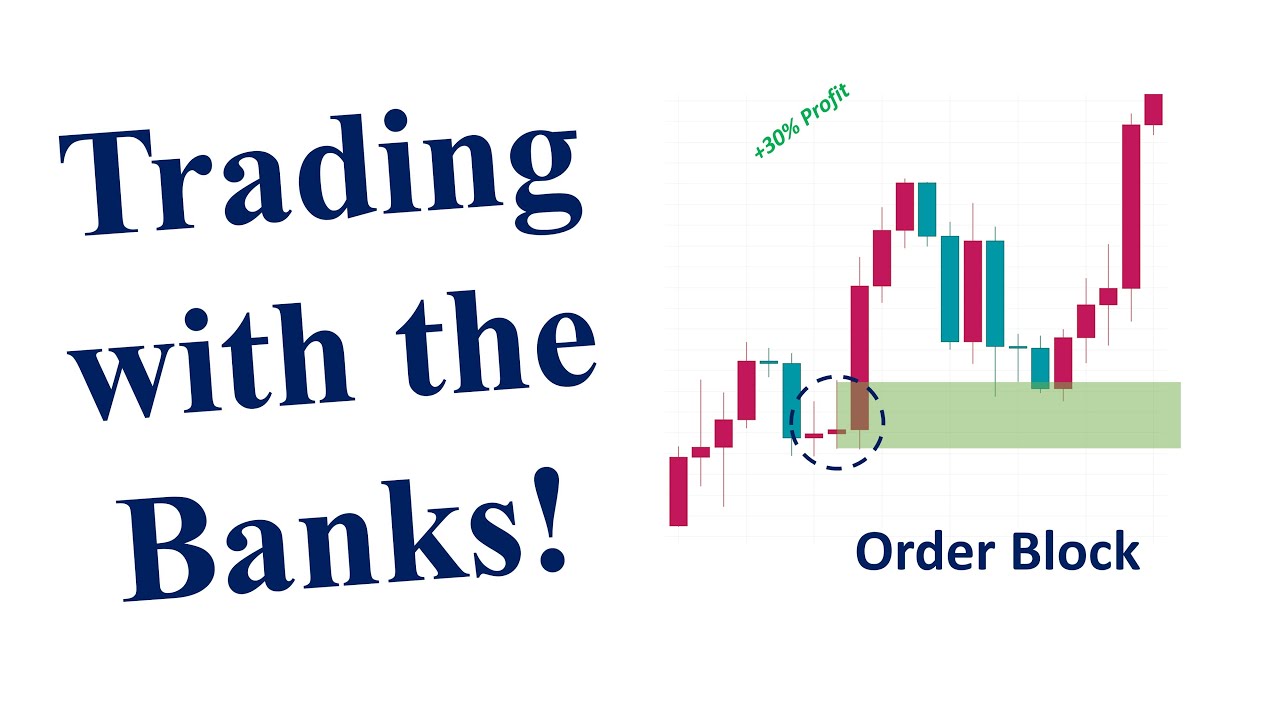
- 😀 Order blocks are areas where large buying or selling orders are concentrated, and they act as significant levels of support or resistance.
- 😀 Not every supply or demand area qualifies as an order block. Only those with specific conditions are considered valid for trading.
- 😀 Inefficiency or fair value gaps are important for identifying order blocks, as they show where the market has been imbalanced, often leading to price reactions.
- 😀 A valid order block is often formed when a price movement breaks the latest market structure, indicating a shift in the market's direction.
- 😀 Liquidity plays a crucial role in enhancing the effectiveness of order blocks. Areas where stop losses are clustered are ideal targets for liquidity grabs.
- 😀 The three common liquidity grab patterns are: fair value gaps below the order block, equal highs/lows, and price retracements before a strong move.
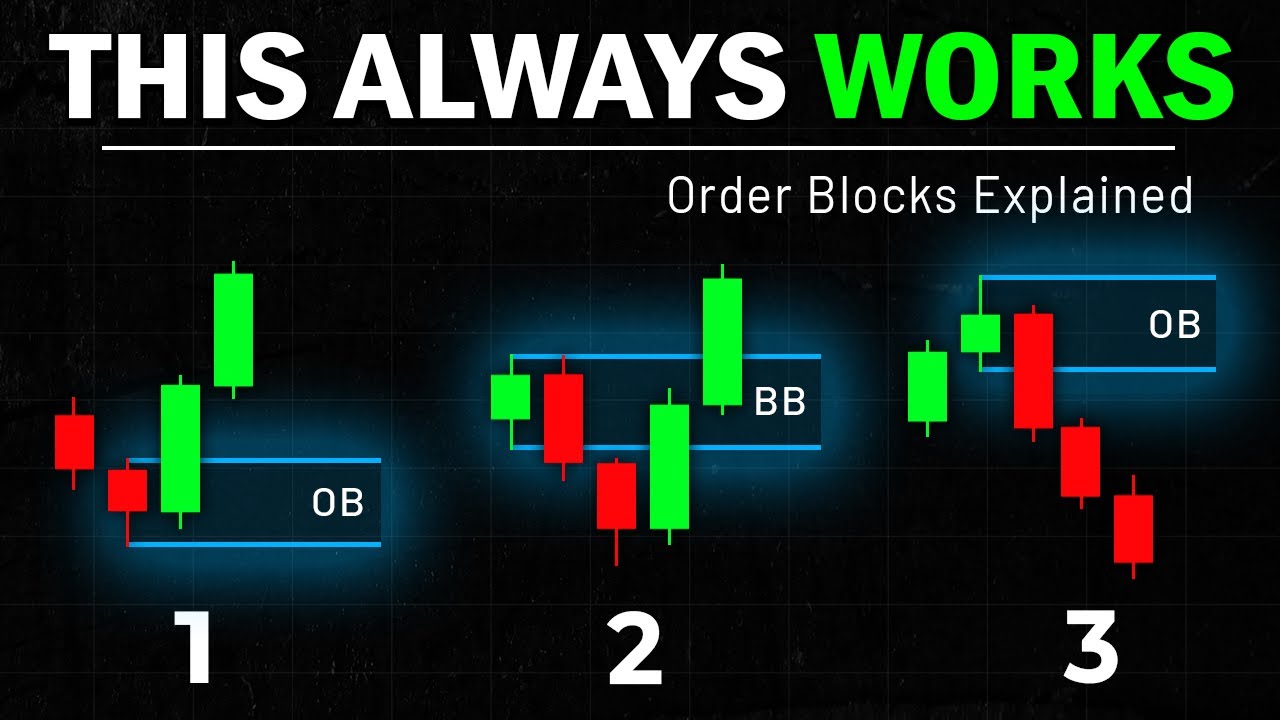
- 😀 To mark an order block on the chart, identify the last candlestick before a drastic price movement, regardless of the candle's color.
- 😀 When an order block candlestick is smaller than 60% of the ATR (Average True Range), extend the order block zone by one ATR on both sides for better precision.
- 😀 Continuation order blocks align with the dominant trend, offering a higher chance of success for traders. Reversal order blocks, though riskier, provide higher risk-to-reward potential.
- 😀 Ranging order blocks form during consolidation and act as rejection areas when the price returns to the range zone, signaling potential price reversals.
- 😀 A top-down analysis approach is essential for successful trading: start with a 4-hour chart to understand the market direction, use the 1-hour chart to find trends and opportunities, and zoom into the 15-minute chart for entry confirmations.
Q & A
What are order blocks in trading?
-Order blocks are areas on the chart where significant buying or selling orders have occurred, creating a level of price rejection. These areas become crucial when price revisits them, potentially leading to future market reactions.
What conditions make an order block valid for trading?
-To consider an order block valid, it must meet certain conditions such as inefficiency or imbalance (fair value gaps), a break in market structure, and liquidity being present in the form of gaps or equal highs/lows that indicate a liquidity grab.
How can inefficiency or fair value gaps be identified on the chart?
-Inefficiency or fair value gaps appear when there is a large movement between candles, creating an imbalance between buyers and sellers. These gaps represent areas where smart money has entered, and price often returns to fill these gaps before continuing the trend.
What is the importance of a market structure break when identifying order blocks?
-A break in market structure, where price closes above a recent high in a bullish scenario or below a recent low in a bearish scenario, indicates a strong demand or supply area. This break signifies that the area is an influential zone, making it a valid order block.
What role does liquidity play in order blocks?
-Liquidity refers to areas where stop-loss orders accumulate. By combining liquidity zones with order blocks, traders can better understand market dynamics. Liquidity grabs often occur before price moves toward an order block, enhancing the quality of the trading setup.
What are some common liquidity grab patterns that enhance order block effectiveness?
-Common liquidity grab patterns include fair value gaps near the order block zone, and equal highs/lows that indicate an accumulation of liquidity. These patterns suggest that smart money may target these areas before price reacts to the order block.
How do you mark an order block on the chart?
-To mark an order block, identify the last candlestick before a significant price movement (upward or downward). This candlestick represents where key decisions were made, making it the center of the order block zone. Adjustments might be made based on the size of the candlestick or ATR measurements.
What should you do if the order block candlestick is smaller than the average candlestick range?
-If the order block candlestick is smaller than 60% of the average candlestick range (using ATR), extend the order block zone to one ATR on both sides to accommodate potential volatility.
What are the different types of order blocks?
-There are three types of order blocks: continuation order blocks, which align with the dominant trend; reversal order blocks, which offer high risk-to-reward potential; and ranging order blocks, which form during periods of price consolidation before a major move.
How does top-down analysis help in trading with order blocks?
-Top-down analysis involves reviewing multiple timeframes to gain a comprehensive understanding of the market. Start with the 4-hour chart for market direction, use the 1-hour chart for detailed analysis of key levels and setups, and use the 15-minute chart for precise execution and confirmations.
Outlines

هذا القسم متوفر فقط للمشتركين. يرجى الترقية للوصول إلى هذه الميزة.
قم بالترقية الآنMindmap

هذا القسم متوفر فقط للمشتركين. يرجى الترقية للوصول إلى هذه الميزة.
قم بالترقية الآنKeywords

هذا القسم متوفر فقط للمشتركين. يرجى الترقية للوصول إلى هذه الميزة.
قم بالترقية الآنHighlights

هذا القسم متوفر فقط للمشتركين. يرجى الترقية للوصول إلى هذه الميزة.
قم بالترقية الآنTranscripts

هذا القسم متوفر فقط للمشتركين. يرجى الترقية للوصول إلى هذه الميزة.
قم بالترقية الآنتصفح المزيد من مقاطع الفيديو ذات الصلة

🔴 1-2-3 ORDER BLOCKS Trading Strategy Banks Don’t Want You To Know About

Daily Bias Was Hard, Until I Understood This

The Ultimate Orderblock Strategy for 2025 (Full Guide)
How To Select The Best Between Orderblock and a Fair Value Gap for Trade Entry
Order Blocks Explained: 3 Best Strategies Revealed
The Concept of Order Blocks - Smart Money Trading
5.0 / 5 (0 votes)
