BEST MACD Trading Strategy [86% Win Rate]
Summary
TLDRThis video introduces a high win rate MACD trading strategy, combining the MACD indicator with a 200-day moving average and price action analysis. It emphasizes entering trades when the MACD lines cross below the zero line in an uptrend and using support/resistance levels for better accuracy.
Takeaways
- 📈 The MACD (Moving Average Convergence Divergence) is a popular technical indicator used to identify trends in the market.
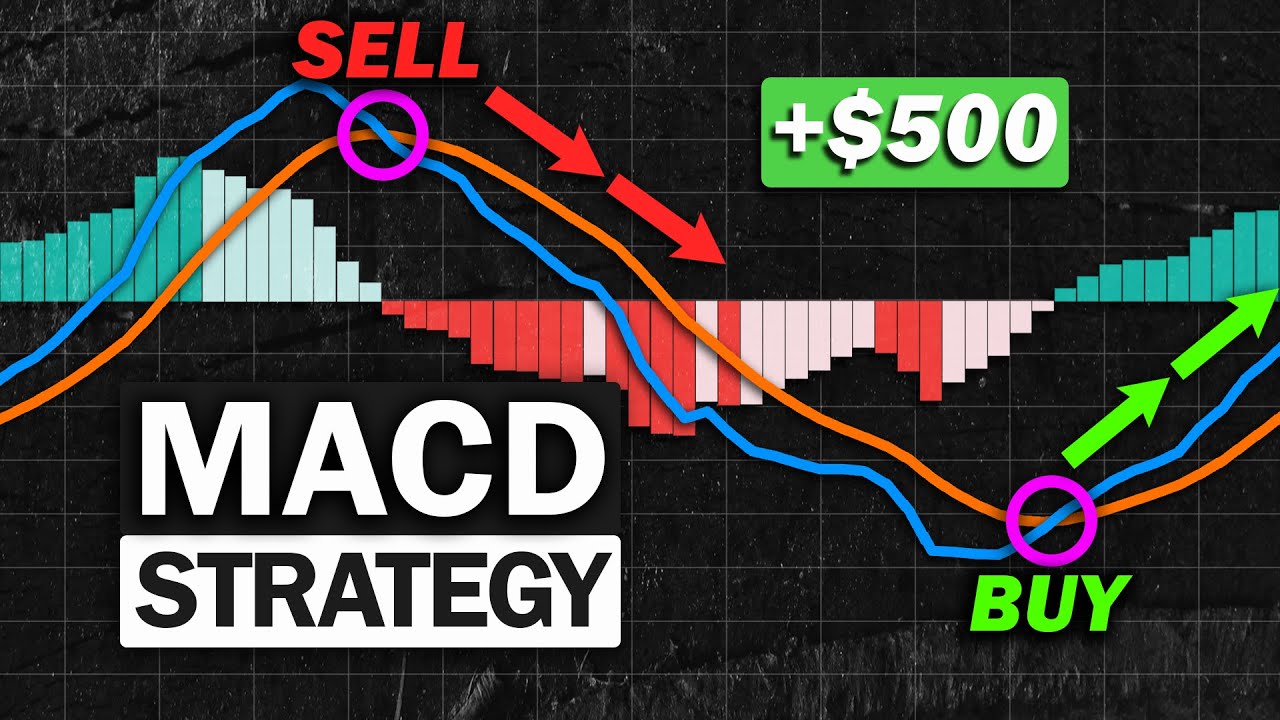
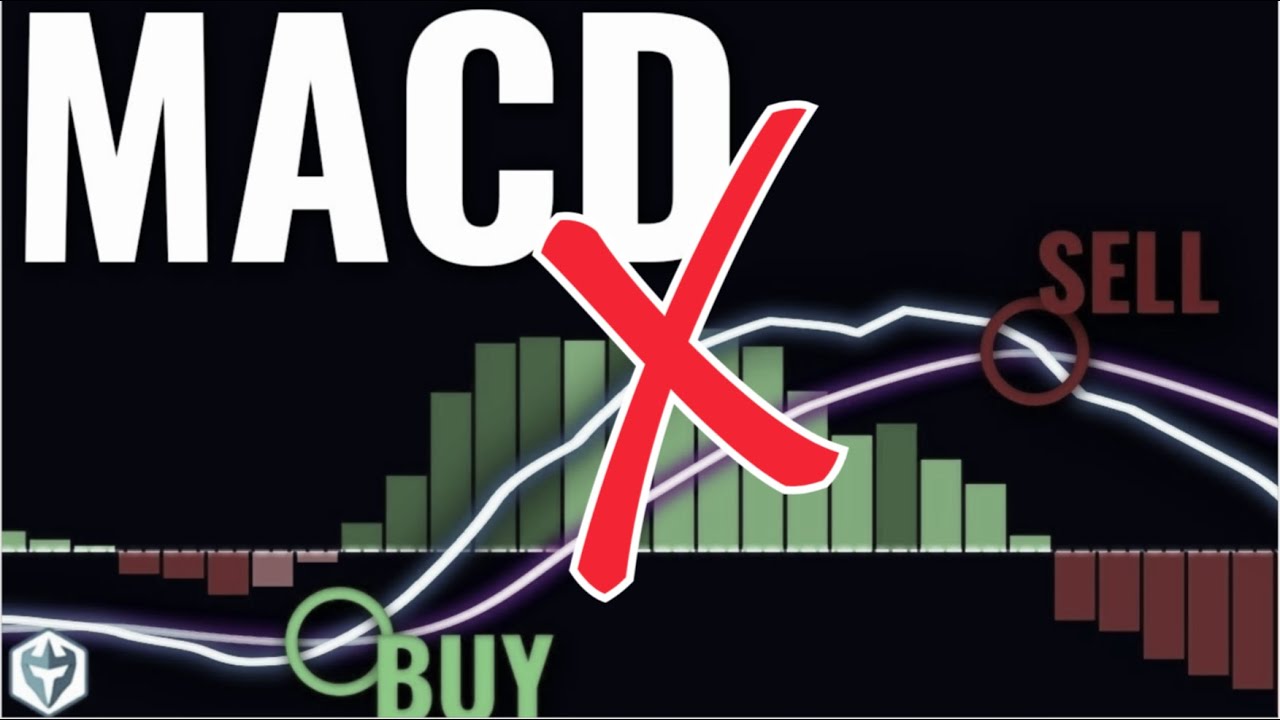
- 🔍 The MACD consists of four components: the MACD line, the signal line, the histogram, and the zero line.
- 🟢 The histogram turns green when the MACD line crosses above the signal line, indicating upward momentum, and red when it crosses below, indicating downward momentum.
- 🚀 MACD is particularly effective at identifying trends but should not be used in isolation as it can give false signals in sideways markets.
- ⚠️ To avoid trading against the trend, combine MACD with a 200-day moving average to ensure trades are made only when the market is trending upwards.
- 💡 Use the MACD indicator for entry signals when the lines cross below the zero line and the price is above the 200-day moving average for long trades.
- 📉 For short trades, wait for the MACD lines to cross downward above the zero line and ensure the price is below the 200-day moving average.
- 🛡️ Set a stop loss below the 200-day moving average to protect against significant price drops.
- 🎯 Aim for a 1.5 profit ratio for the profit target to maximize returns on successful trades.
- 🔄 The strategy may give false signals in range-bound markets, so it's crucial to combine MACD with price action analysis.
- 📊 Use price action by identifying key support or resistance levels and waiting for the MACD to confirm a momentum change before entering a trade.
Q & A
What is the MACD strategy discussed in the video?
-The MACD strategy discussed in the video is a high win rate trading strategy that uses the Moving Average Convergence Divergence (MACD) indicator. It involves analyzing the MACD line, signal line, histogram, and zero line to identify trends and momentum in the market.
What are the four components of the MACD indicator?
-The four components of the MACD indicator are the MACD line (usually a 12-day moving average), the signal line (usually a 26-day moving average), the histogram (which shows the difference between the MACD line and the signal line), and the zero line (which represents the center of the MACD indicator).
How does the MACD indicator help in identifying market trends?
-The MACD indicator helps in identifying market trends by showing when the MACD line crosses above or below the signal line. A cross above indicates upward momentum, while a cross below indicates downward momentum. The histogram also provides insight into the strength of the momentum.
Why is the MACD indicator alone not sufficient for trading?
-The MACD indicator alone is not sufficient for trading because it works well only when the market is in a clear trend. It can give false signals in a sideways or range-bound market, leading to potential losses.
How can the 200-day moving average be used in conjunction with the MACD strategy?
-The 200-day moving average can be used to determine the overall trend of the market. If the price is above the 200-day moving average, the market is in an uptrend, and if the price is below, it's in a downtrend. This helps in deciding when to enter a trade based on the MACD signals.
What are the conditions for entering a long trade using the MACD strategy?
-To enter a long trade using the MACD strategy, the MACD lines should cross below the zero line, and the current price should be above the 200-day moving average. This ensures that the trade is entered when the market is in an uptrend.
How can you improve the MACD strategy to avoid false signals in a sideways market?
-To avoid false signals in a sideways market, the MACD strategy can be combined with price action analysis. This involves identifying key support or resistance levels where the price has previously bounced off and expecting similar behavior in the future.
What is the role of support and resistance levels in the MACD strategy?
-Support and resistance levels help in confirming the potential for a price bounce in the MACD strategy. When the price hits a key support level, it is expected to bounce off and move upwards, providing a good entry point for a trade if the MACD lines also cross below the zero line.
How should a stop loss be set in the MACD strategy?
-In the MACD strategy, a stop loss should be set below the 200-day moving average. This acts as a barrier that the price must break through to trigger the stop loss, helping to manage risk.
What is the profit target ratio suggested in the video for the MACD strategy?
-The video suggests a profit target ratio of 1.5 for the MACD strategy. This means that the profit target is set at 1.5 times the distance from the entry point to the stop loss.
Outlines
📈 Introduction to High Win Rate MACD Trading Strategy
The video script introduces a high win rate MACD (Moving Average Convergence Divergence) trading strategy, emphasizing its ease of use and profitability across various markets. The MACD is a popular technical indicator that uses moving averages to identify market trends. The script explains the four components of the MACD: the MACD line, the signal line, the histogram, and the zero line. It also discusses the importance of using the MACD in conjunction with other indicators for better performance. The MACD line crossing above the signal line indicates upward momentum, while a downward cross signifies a downward trend. The histogram's size reflects the momentum's strength. The strategy involves entering trades when the MACD lines cross upward below the zero line and ensuring the price is above the 200-day moving average to confirm an uptrend.
🔍 Enhancing MACD Strategy with Price Action and Moving Averages
This paragraph delves into improving the MACD strategy by combining it with price action analysis and the 200-day moving average. It acknowledges the strategy's effectiveness during periods of significant price movement but points out its limitations during sideways market trends, which can lead to false signals. To address this, the script suggests using the MACD in conjunction with identifying key support or resistance levels where the price is expected to bounce. The strategy is refined to enter a long trade when the MACD lines cross below the zero line, the price is above the 200-day moving average, and the price hits a previously established support level. The script also mentions setting a stop loss below the 200-day moving average and aiming for a 1.5 profit ratio for the profit target. The video concludes by encouraging viewers to like and subscribe for future strategies, promising an even better strategy in the next video.
Mindmap
Keywords
💡MACD Strategy
💡Moving Average Convergence Divergence (MACD)
💡Trend
💡Signal Line
💡Histogram
💡Zero Line
💡200 Day Moving Average
💡Price Action
💡Support and Resistance
💡Stop Loss
💡Profit Target
Highlights
The MACD strategy presented has one of the highest win rates in trading.
The MACD is a popular technical indicator that uses moving averages to find market trends.
The MACD indicator alone is just average; it needs to be paired with other indicators for better performance.
The MACD indicator consists of four components: the MACD line, signal line, histogram, and zero line.
The MACD line is typically a 12-day moving average, and the signal line is a 26-day moving average.
The histogram shows the difference between the MACD line and the signal line, indicating momentum.
A cross above the signal line by the MACD line indicates upward momentum, and vice versa for a downward cross.
The histogram turns green when the MACD line crosses above the signal line and red when it crosses below.
The zero line represents the center of the MACD indicator.
The MACD indicator is effective at identifying market trends and momentum changes.
Entering a trade is recommended when the MACD lines cross upward below the zero line, and the price is above the 200-day moving average.
Avoid trading against the trend; use the 200-day moving average to determine the market trend.
A price above the 200-day moving average indicates an uptrend, and below indicates a downtrend.
For shorting, enter a trade when the MACD lines cross downward above the zero line, and the price is below the 200-day moving average.
Combining the MACD with a 200-day moving average improves the strategy's effectiveness in trending markets.
False signals can occur when the market lacks momentum and moves sideways.
Combining the MACD with price action, such as support and resistance levels, can reduce false signals and improve the strategy.
Waiting for the MACD lines to cross below the zero level after the price hits support can be a good entry point for a trade.
The strategy's success is maximized when the MACD, 200-day moving average, and support/resistance levels are all aligned.
Transcripts
MACD Strategy This MACD strategy I m
about to show you is one of the highest win rate strategies you can possibly do in trading. It
is very easy to use, works in almost every single market, and most importantly, it makes money. Well
enough talk, lets get straight into it. The MACD or the Moving Average Convergence
Divergence is one the most popular technical indicators used by traders. Essentially this
indicator uses moving averages to find trends in markets, and its pretty damn good at it too.
Now, if you re an experienced trader, you ve probably used or
heard about the MACD indicator before. But the MACD indicator by itself, is just
alright to be honest. So, make sure you watch this full video to see how I pair it with some other
indicators to make it perform so much better. First things first, let s add the MACD indicator
to our chart. To do that .
Now that we have the MACD indicator added, lets make sure we know how the MACD actually works.
The MACD is made up of 4 different components. The MACD line, the signal line,
the histogram, and the zero line. The MACD line which is the blue line,
in most cases is usually a 12 day moving average, the signal line, which is the
orange line, is usually a 26 day moving average. Next we have the histogram, which represents the
difference between the MACD line and the signal line. So for example, the smaller the space
between the two lines, the smaller the histogram gets. The bigger the space, the bigger it gets.
You can also see once the MACD line crosses above the signal line,
the histogram turns green and if the MACD line crosses below the signal line it turns red.
And finally, we have the zero line, which basically represents
the center of the MACD indicator. Now that we know the 4 components,
lets make sure we know how to them. The MACD indicator is insanely good at
finding trends in markets. How you can tell if a chart is about to have an upward trend
is by looking for a cross upwards between the MACD line and the Signal line.
For example, here the macd crosses above the signal line indicating the chart is in upward
momentum, and here the macd crosses below the signal line indicating it s in downward momentum.
You can also use the histogram to indicate how much momentum there actually is. So,
if the histogram is getting bigger, that means there is an increase in momentum. If it s
getting smaller, there is a decrease in momentum. So how you want to use this indicator is by when
the lines cross upward, but only if they cross below the zero line. If they cross and its above
the zero line you wouldn t enter a trade. It s the same thing with shorting,
you only enter a short trade if the lines are crossing downward, and is ABOVE the zero line.
So as you can see, this indicator is extremely easy to use. But the problem most traders
encounter, is that they use this indicator by itself. Let me tell you why this doesn t work.
The MACD indicator works extremely well if the market is in a trend. So for example here,
the MACD indicator is doing a great job indicating when the price is about to move
upward. Because the chart is in an upward trend. But here, the price is in a downward trend,
but the MACD is still signaling to buy long even though the price is going down.
To fix this issue, for example if we are trading long, we only want
to trade if the market is in an uptrend. You never want to trade against the trend,
because the odds will always be against you. So, an easy way to figure out if the market
is in an uptrend. You simply just need to add a 200 day moving average.
To do this Once we have the indicator added,
you ll just see a single line. If the price is above that line,
the market is in an uptrend. If the price is below that line, the market is in a downtrend.
So after learning that we only want to buy when the market is in uptrend, if
we re going long of course. if we put all this together,
we buy if the macd lines cross below the zero line mark, and the current price
also above the 200 day moving average. This will guarantee that you are only
trading when the market is in an uptrend, which is a very power combo.
If you wanted to short, you would just do the exact opposite. Make sure the price is
below the 200 day average and the macd lines are crossing downward above the zero line.
So as an example we would enter a long trade right here, because the macd lines are crossing
upward below the zero line, and the current price is above the 200 day moving average.
Now what I like to do is set a stop loss below the 200 day moving average, so the 200 day almost acts
as a wall that the price has to break through to hit my stop loss. Then I like to have a 1.5
profit ratio for my profit target mark. So as you can see for this example,
the strategy worked exactly as we wanted it to, and we made money.
But, we can still make this trading strategy even better.
This macd strategy combined with a 200 day moving average, works extremely well only if there is a
lot of price movement. Where the strategy starts to get kind of iffy and giving false signals,
is when the chart starts going sideways and losing momentum.
So as you can see here the chart is moving sideways and lost almost all of its upward
momentum and the macd is giving lots of false signals. If you traded here,
odds are you probably lost money. To fix this issue we have to combine the
MACD with price action. To do this, identify a key support or resistance where price hits
and bounces. So as you can see the prices goes down, hits this point, and reverses upwards.
The next step is to wait for the price to hit the same key level again. Once it does,
we are expecting the price to bounce off this support and go upwards just like it did before.
But as a clear note, just because we made the support and it bounced off this before,
doesn t mean that it will always do that again. It can easily break through the support and drop
lower if it has enough momentum. If we want to make sure the price
is about to change in momentum, that s when we bring out the MACD indicator.
So what you would do, is make sure the price above the 200 day moving average,
once the price hits the support made, wait for the lines on the MACD to cross below the zero level,
and that s when you enter the trade. So I just revealed to you how the MACD,
200 day moving average, and using support and resistances levels gives and extremely
high win rate with this strategy. All I ask for in return is if you
to take 2 seconds of your time and like this video. If you want to stay up to
date with my future strategies make to subscribe. Because in my next video,
I m planning to release a strategy that works even ever better than this MACD strategy.
Hope you guys learned something from this video, and I ll see you guys next time.
تصفح المزيد من مقاطع الفيديو ذات الصلة
Bollinger Band + RSI Trading Strategy That Actually Works
MACD Indicator Explained: 4 Advanced Strategies
Best Easy Trading Strategy – Stop Wasting Time NOW! *HIGH WIN RATE
Master Support & Resistance Levels (ALL YOU NEED TO KNOW)
INTRADAY STRATEGY - PIVOT + VWAP + EMA
Stochastic Trading Strategy for Stock Trading | Trading Strategy For Beginners
5.0 / 5 (0 votes)