CALCULATING THE PEARSON'S SAMPLE CORRELATION COEFFICIENT || SHS STATISTICS AND PROBABILITY
Summary
TLDRThis video tutorial explains how to calculate the Pearson sample correlation coefficient, a statistical measure that assesses the strength and direction of the linear relationship between two variables. The instructor walks through an example involving a statistics professor comparing student test scores with their GPA, demonstrating step-by-step calculations using the Pearson formula. Key concepts include constructing tables, summing values, and interpreting the resulting correlation coefficient. With a final r value of 0.72, the example highlights a strong positive relationship, providing viewers with a clear understanding of both the formula and its real-world application.
Takeaways
- 😀 Pearson's sample correlation coefficient (r) measures the strength and direction of a linear relationship between two variables.
- 😀 The formula for calculating the Pearson correlation coefficient involves sums of x, y, their squares, and their products.
- 😀 Pearson's correlation coefficient ranges from -1 to 1, where -1 indicates a perfect negative correlation, +1 indicates a perfect positive correlation, and 0 indicates no correlation.
- 😀 A positive r value indicates a positive correlation, meaning as one variable increases, so does the other.
- 😀 A negative r value indicates a negative correlation, meaning as one variable increases, the other decreases.
- 😀 A value closer to 1 or -1 signifies a stronger linear relationship, while values near 0 suggest a weaker relationship.
- 😀 Scatter plots can be used to visually estimate the direction (positive/negative) and strength (weak/strong) of a correlation.
- 😀 For strong positive correlations, the points on a scatter plot will rise from left to right, while for strong negative correlations, they will fall from left to right.
- 😀 In the example, a statistics professor calculates the correlation between test scores and GPA, demonstrating the use of the Pearson coefficient formula.
- 😀 The final calculation for the given example results in a Pearson correlation coefficient of 0.72, indicating a strong positive correlation between test scores and GPA.
- 😀 To compute Pearson's r, intermediate values such as the sum of the products of x and y, and the sums of squares of x and y must first be calculated.
Q & A
What is the Pearson Sample Correlation Coefficient?
-The Pearson Sample Correlation Coefficient (r) is a test statistic that measures the strength and direction of the linear relationship between two variables. It is a number between -1 and 1.
What does an r value greater than 0 indicate?
-An r value greater than 0 indicates a positive correlation, meaning that as one variable increases, the other tends to increase as well.
What does an r value less than 0 indicate?
-An r value less than 0 indicates a negative correlation, meaning that as one variable increases, the other tends to decrease.
What does an r value equal to 0 indicate?
-An r value of 0 indicates no linear correlation between the two variables, meaning there is no predictable relationship between them.
What does an r value of 1 or -1 indicate?
-An r value of 1 indicates a perfect positive linear correlation, while an r value of -1 indicates a perfect negative linear correlation.
How do you calculate the Pearson correlation coefficient?
-The Pearson correlation coefficient is calculated using the formula: r = (nΣxy - (Σx)(Σy)) / √[(nΣx² - (Σx)²)(nΣy² - (Σy)²)] where n is the number of data pairs, Σx is the sum of x values, Σy is the sum of y values, Σxy is the sum of the products of the paired scores, Σx² is the sum of the squared x values, and Σy² is the sum of the squared y values.
What is the significance of a positive correlation in real-life scenarios?
-In real-life scenarios, a positive correlation means that as one variable increases, the other variable tends to increase as well. For example, a strong positive correlation between study hours and exam scores suggests that more study time generally leads to better scores.
How do you interpret the strength of a correlation?
-The strength of a correlation is determined by the absolute value of r. A value close to 1 or -1 indicates a strong correlation, while a value close to 0 indicates a weak correlation. For example, an r of 0.72 suggests a strong positive correlation.
What is the formula used to compute the Pearson correlation coefficient for a set of data?
-The formula to compute the Pearson correlation coefficient is: r = (nΣxy - (Σx)(Σy)) / √[(nΣx² - (Σx)²)(nΣy² - (Σy)²)] where n is the number of data points, Σx is the sum of x values, Σy is the sum of y values, Σxy is the sum of the products of x and y values, Σx² is the sum of squared x values, and Σy² is the sum of squared y values.
How do you interpret the r value of 0.72 in the example problem?
-In the example problem, the r value of 0.72 indicates a strong positive correlation between test scores and GPA. This means that as students' test scores increase, their GPA tends to increase as well.
Outlines

هذا القسم متوفر فقط للمشتركين. يرجى الترقية للوصول إلى هذه الميزة.
قم بالترقية الآنMindmap

هذا القسم متوفر فقط للمشتركين. يرجى الترقية للوصول إلى هذه الميزة.
قم بالترقية الآنKeywords

هذا القسم متوفر فقط للمشتركين. يرجى الترقية للوصول إلى هذه الميزة.
قم بالترقية الآنHighlights

هذا القسم متوفر فقط للمشتركين. يرجى الترقية للوصول إلى هذه الميزة.
قم بالترقية الآنTranscripts

هذا القسم متوفر فقط للمشتركين. يرجى الترقية للوصول إلى هذه الميزة.
قم بالترقية الآنتصفح المزيد من مقاطع الفيديو ذات الصلة
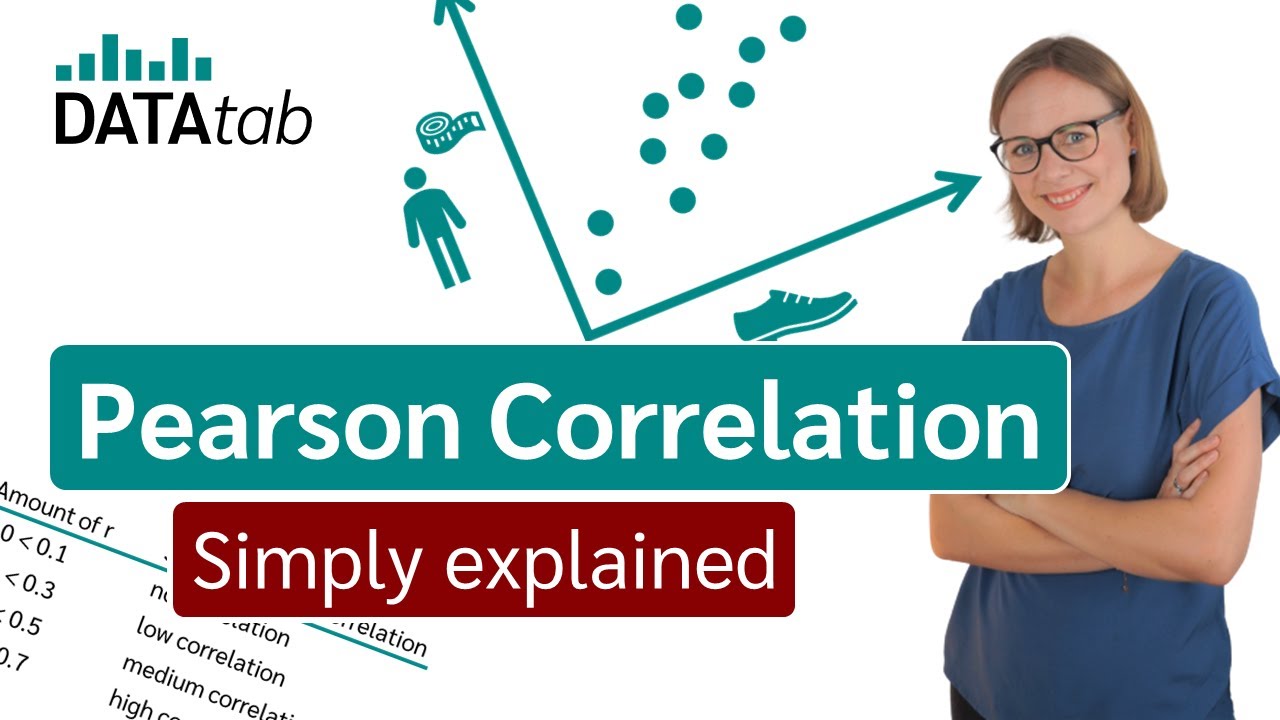
Pearson correlation [Simply explained]

[Tagalog] Pearson (r) Product Moment Correlation Coefficient - Computation and Interpretation
Spearmen's Rank Correlation || Gnani The Knowledge ||
Correlation vs Regression | Difference Between Correlation and Regression | Statistics | Simplilearn
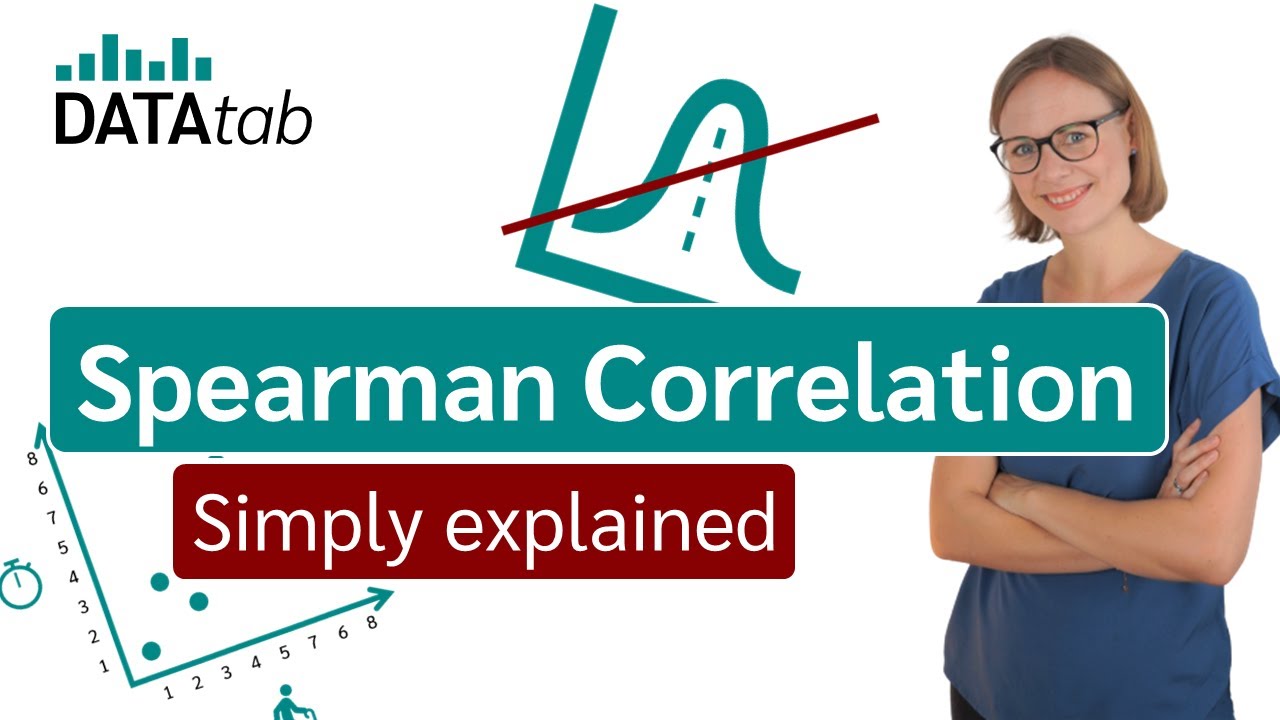
Spearman Rank Correlation [Simply explained]

Korelasi Product Moment (r) Hal 110-116 Bab 3 STATISTIK Kelas 11 SMA Kurikulum Merdeka
5.0 / 5 (0 votes)
