Buying Into All Time Highs On Nasdaq [Trade Breakdown]
Summary
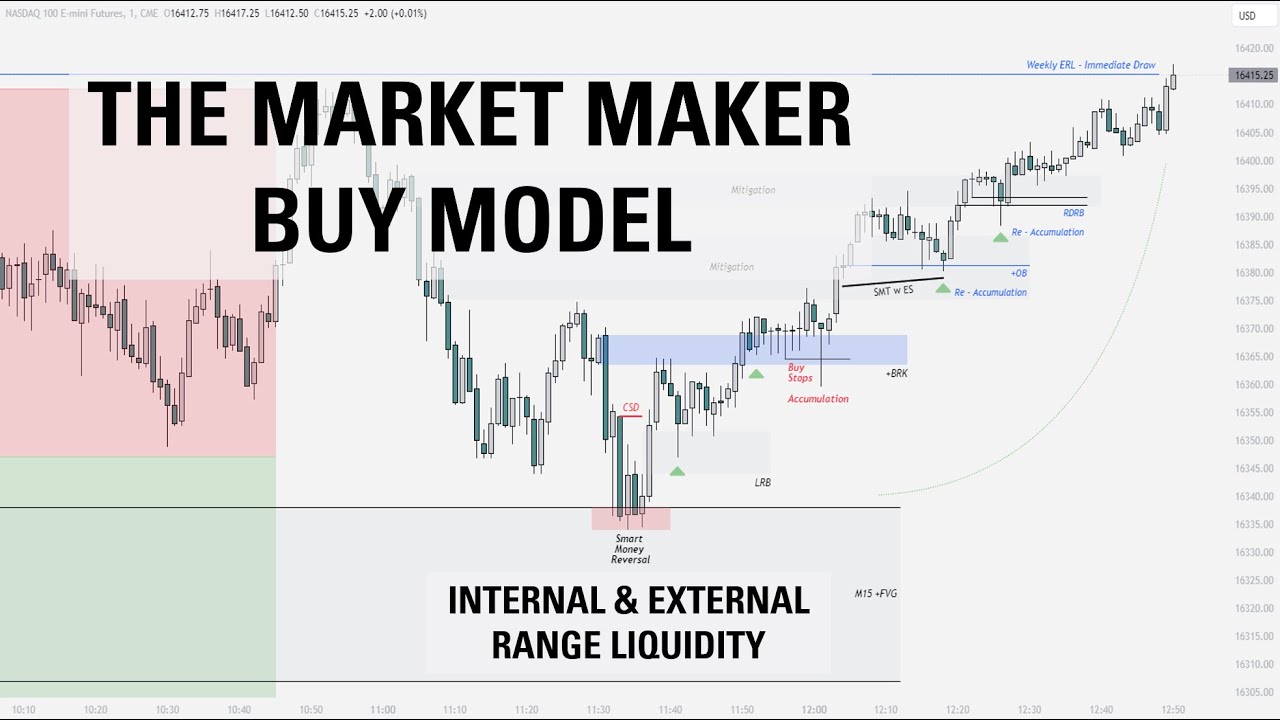
TLDRIn this lecture, the trader breaks down a step-by-step approach to trading NASDAQ at all-time highs using a market maker buy model. The video covers identifying key levels, bullish breakers, and drawn liquidity, then confirms trades through smart money techniques, change in state delivery, and timing alignment. Viewers learn to recognize market structure, engineer liquidity, and use lower time frame fractals to refine entries. The methodology emphasizes consistent protocol: identify order flow, determine drawn liquidity, confirm reversal, and execute trades with precise stop-loss and target placement. Clear visuals and practical examples demonstrate high reward-to-risk setups and systematic trading discipline.
Takeaways
- 😀 Price displacement above previous highs can create a bullish breaker, turning former resistance into support.
- 😀 Drawn liquidity represents the next key price level that price is expected to gravitate towards.
- 😀 Market Maker Buy Models follow a pattern: expansion higher → retracement lower → expansion higher.
- 😀 Narrative in trading is the projected path from Point of Interest (POI) to drawn liquidity.
- 😀 Confirmation of a Smart Money Reversal (SMR) requires three components: CSD, SMT, and time alignment with price.
- 😀 Change of State Delivery (CSD) occurs when a sell program transitions into a buy program, often confirmed with a bullish breaker.
- 😀 Smart Money Technique (SMT) validates reversals by comparing relative price action across correlated markets.
- 😀 Fractal trading allows smaller market maker models within larger ones to be used for precise entries and better risk/reward ratios.
- 😀 Targeting drawn liquidity instead of intermediate consolidations can result in high reward-to-risk trades (e.g., 10:1 to 13.4:1).
- 😀 Consistency in trading relies on following a protocol: identify order flow → define liquidity → confirm reversal → execute trade.
- 😀 Left side of the curve identifies premium and discount arrays; discount arrays above price act as support for trade decisions.
- 😀 Engineer liquidity occurs when price forms highs/lows to attract orders, often preceding a retracement to POI.
Q & A
What is the main concept of the trading strategy discussed in the video?
-The main concept is using a market maker buy model, combined with liquidity analysis and smart money techniques (SMT), to identify trade setups. The goal is to trade NASDAQ to new all-time highs by analyzing price action, identifying liquidity, and confirming entry points with specific patterns.
What does 'engineered liquidity' refer to in the context of the trading strategy?
-Engineered liquidity refers to a price level where the market has created liquidity through a high or low that draws buyers or sellers into the market. This is typically seen when price retraces lower after making an expansion higher, creating a liquidity zone that traders can target.
Why is the 24,800 price level significant in this strategy?
-The 24,800 price level is significant because it represents a round number that forms an important liquidity zone. It also marks a level where price expansion and retracement have occurred, creating a potential target for traders as it reflects previous price behavior and market structure.
What is the role of the 'bullish breaker' in the trading strategy?
-The bullish breaker serves as a key support level in the strategy. It forms when price displaces above the previous resistance, which, once surpassed, is expected to act as support. This break in structure helps confirm that the market is in a bullish order flow, supporting long trade setups.
What is the difference between 'original consolidation' and 'drawn liquidity'?
-Original consolidation refers to a price zone where the market had previously established balance before moving higher or lower. Drawn liquidity, on the other hand, is the next target for price to reach, which can be a predefined price level, often marked by a round number or significant price structure, that traders expect price to gravitate toward.
How does SMT (Smart Money Tools) confirm the market reversal?
-SMT is used to confirm market reversals by comparing the behavior of different indices, like ES and NASDAQ. If one index (e.g., ES) makes a lower low while NASDAQ fails to do so, it signals divergence and validates the reversal. This is a key signal that smart money is driving the market in the opposite direction.
What is the significance of 'time alignment with price' in this strategy?
-Time alignment with price refers to the concept of aligning key market events (e.g., reversals) with specific time windows, such as macro windows (9:45 to 10:15). When price aligns with these windows, it increases the probability of a successful trade. This concept helps confirm that the market is behaving in line with expected patterns.
How is the market maker buy model confirmed on lower time frames?
-The market maker buy model is confirmed on lower time frames by observing a sequence of price actions: expansion lower, retracement higher, and then another expansion higher. On lower time frames, this pattern becomes clearer, confirming that the market is following a market maker buy model and is set to move toward the drawn liquidity.
What is the process of fractalizing a market maker buy model?
-Fractalizing involves applying the same market maker buy model on lower time frames. In the video, the trader uses a smaller-scale version of the original buy model to enter a trade at a more precise point, targeting the larger market's drawn liquidity rather than the smaller model's consolidation zone.
Why is the strategy considered repeatable across different trades?
-The strategy is considered repeatable because the sequence of events and steps is consistent across different market scenarios. The trader always starts by identifying order flow, then defines drawn liquidity, waits for a price retracement to a point of interest, confirms the reversal with SMT and CSD, and finally enters the trade once everything aligns.
Outlines

هذا القسم متوفر فقط للمشتركين. يرجى الترقية للوصول إلى هذه الميزة.
قم بالترقية الآنMindmap

هذا القسم متوفر فقط للمشتركين. يرجى الترقية للوصول إلى هذه الميزة.
قم بالترقية الآنKeywords

هذا القسم متوفر فقط للمشتركين. يرجى الترقية للوصول إلى هذه الميزة.
قم بالترقية الآنHighlights

هذا القسم متوفر فقط للمشتركين. يرجى الترقية للوصول إلى هذه الميزة.
قم بالترقية الآنTranscripts

هذا القسم متوفر فقط للمشتركين. يرجى الترقية للوصول إلى هذه الميزة.
قم بالترقية الآنتصفح المزيد من مقاطع الفيديو ذات الصلة
The Market Maker Buy Model | Full Trade Breakdown $NQ

Trading Against Order Flow Using MMSM (Trade Breakdown)

Market Maker Models Explained | Step By Step Approach | ICT Concepts

ICT MMXM - My Secret Way to Read Market Maker Moves for Beginners

2022 ICT Mentorship [No Rant] ep. 3 - Internal Range Liquidity & Market Structure Shifts

Stupid ICT IFVG Trading Strategy That Works
5.0 / 5 (0 votes)
