Cara Mudah Mencari Uji Koefisien Korelasi Sederhana Dan Berganda
Summary
TLDRThis video demonstrates how to perform both simple and multiple correlation coefficient tests using Excel. The presenter guides viewers through setting up data for three variables—work discipline (X1), training (X2), and performance (Y). The simple correlation test shows a very strong relationship (0.943) between X1 and Y. The multiple correlation test reveals a strong relationship (0.945) between X1, X2, and Y. Viewers are taught how to interpret correlation results based on a predefined guideline. The video aims to provide a clear, beginner-friendly approach to correlation testing in Excel.
Takeaways
- 😀 The tutorial focuses on performing simple and multiple correlation coefficient tests using Excel.
- 😀 The data consists of three variables: S1 (work discipline), S2 (training), and Y (performance), with results from 10 respondents.
- 😀 The first test is a simple correlation between X1 (work discipline) and Y (performance).
- 😀 The correlation value for the simple test is 0.943, indicating a very strong relationship based on the guideline (0.800–1.000).
- 😀 The multiple correlation coefficient test examines the relationship between both X1 (work discipline) and X2 (training) with Y (performance).
- 😀 The result of the multiple correlation test shows a value of 0.945, also indicating a very strong relationship.
- 😀 The correlation interpretation guideline categorizes values between 0.800 and 1.000 as representing a very strong relationship.
- 😀 The tutorial highlights the ease of using Excel to perform both simple and multiple correlation tests.
- 😀 The script provides step-by-step instructions on how to set up and interpret correlation tests in Excel.
- 😀 The video concludes by encouraging viewers to like, comment, and subscribe, and to leave questions in the comments section.
Q & A
What is the main topic of the video?
-The main topic of the video is about conducting a simple and multiple correlation coefficient test using Excel.
What variables are being tested in the correlation coefficient test?
-The variables being tested are S1 (Work Discipline), S2 (Training), and Y (Performance).
How is the simple correlation coefficient test conducted in the video?
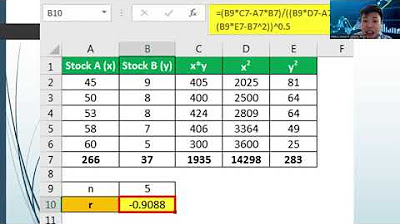
-The simple correlation coefficient test is conducted by analyzing the relationship between X1 (Work Discipline) and Y (Performance). The result is a correlation coefficient of 0.943, indicating a very strong relationship.
What is the interpretation of the correlation coefficient value of 0.943?
-A correlation coefficient of 0.943 is interpreted as a very strong relationship, according to the correlation interpretation guideline, which ranges from 0.800 to 1.000.
How does the video describe the process of finding the multiple correlation coefficient?
-The process involves using linear regression in Excel. The dependent variable is Y (Performance), and the independent variables are X1 (Work Discipline) and X2 (Training). After clicking the necessary options in Excel, the correlation coefficient (R) of 0.945 is found.
What is the interpretation of the multiple correlation coefficient value of 0.945?
-A multiple correlation coefficient value of 0.945 is considered to have a strong relationship, based on the same correlation interpretation guideline of 0.800 to 1.000.
What is the difference between a simple and a multiple correlation coefficient test as explained in the video?
-A simple correlation coefficient test analyzes the relationship between one independent variable (X1) and the dependent variable (Y), while a multiple correlation coefficient test analyzes the relationship between two independent variables (X1 and X2) and the dependent variable (Y).
What statistical method is used for the multiple correlation coefficient test?
-The statistical method used for the multiple correlation coefficient test is linear regression in Excel.
What should you do to conduct the analysis in Excel?
-To conduct the analysis, you need to open Excel, input the data for variables X1, X2, and Y, and then use the 'Analyze' and 'Linear Regression' options to find the correlation coefficient for both simple and multiple tests.
What are the final takeaways from the video?
-The final takeaway is that calculating the simple and multiple correlation coefficient tests in Excel is straightforward, and understanding the correlation values helps interpret the strength of the relationships between variables.
Outlines

هذا القسم متوفر فقط للمشتركين. يرجى الترقية للوصول إلى هذه الميزة.
قم بالترقية الآنMindmap

هذا القسم متوفر فقط للمشتركين. يرجى الترقية للوصول إلى هذه الميزة.
قم بالترقية الآنKeywords

هذا القسم متوفر فقط للمشتركين. يرجى الترقية للوصول إلى هذه الميزة.
قم بالترقية الآنHighlights

هذا القسم متوفر فقط للمشتركين. يرجى الترقية للوصول إلى هذه الميزة.
قم بالترقية الآنTranscripts

هذا القسم متوفر فقط للمشتركين. يرجى الترقية للوصول إلى هذه الميزة.
قم بالترقية الآنتصفح المزيد من مقاطع الفيديو ذات الصلة
[Mathematics in the Modern World] Correlation & Simple Linear Regression

La régression linéaire, quelques explications

Regresi linear, koefisien korelasi dan koefisien determinasi, by Top Mat
Modul 12 (StatSos2) - Konsep Dasar Regresi Linear Sederhana
Statistics Lecture 5 Test of Relationship
How To Perform A Pearson Correlation Test In Excel
5.0 / 5 (0 votes)
