Descriptive Statistics vs Inferential Statistics | Measure of Central Tendency | Types of Statistics

Digital E-Learning
29 Nov 202308:28

Summary

TLDRThis video script offers an insightful overview of statistics, distinguishing between descriptive and inferential statistics. Descriptive statistics focus on summarizing and presenting data through measures of central tendency, spread, and shape. Inferential statistics extend to making predictions and inferences about a population from sample data, including confidence intervals, hypothesis testing, and regression analysis. The script also provides examples and formulas for calculating mean, median, mode, range, variance, and standard deviation, encouraging viewers to engage with the content through subscription, likes, and comments.

Takeaways

  • 📚 Statistics is a branch of mathematics that involves the collection, analysis, interpretation, presentation, and organization of data, used across various fields.
  • 👨‍🏫 Gottfried Wilhelm Leibniz, a German philosopher and economist, is known as the father of statistics.
  • 📊 Statistics combines elements from trigonometry, geometry, algebra, calculus, and number systems to analyze and draw conclusions from data.
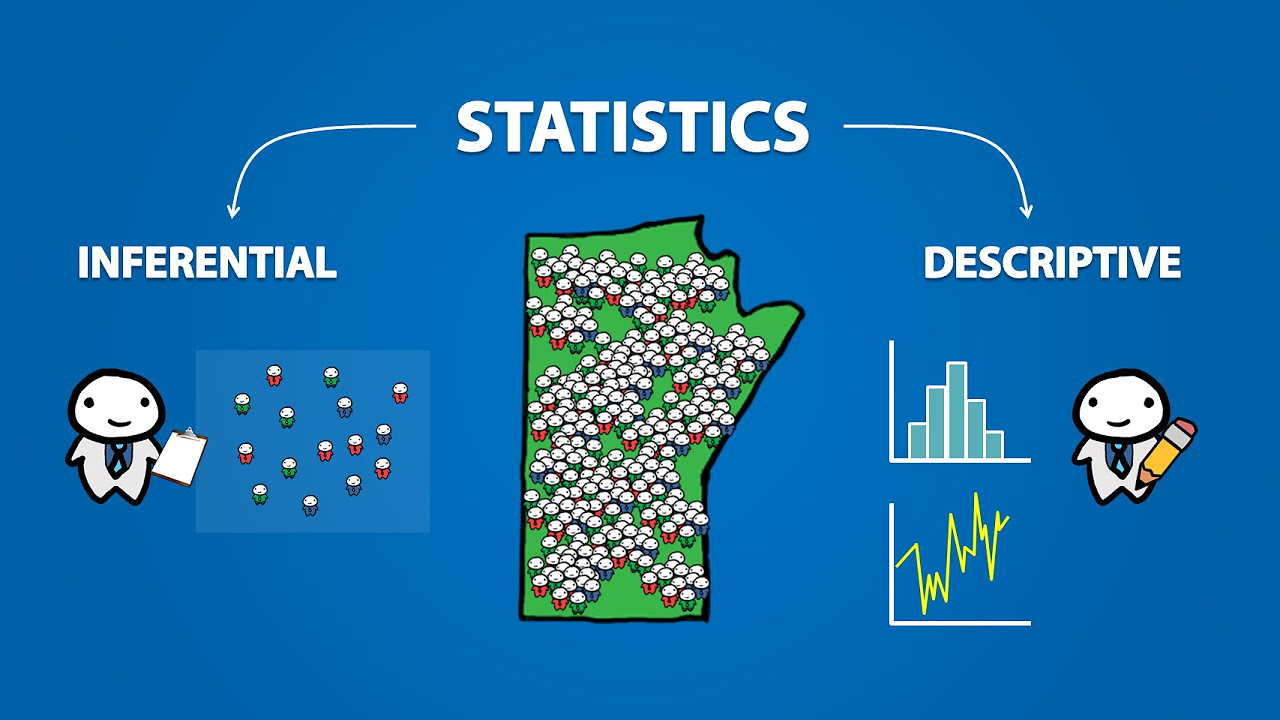
  • 📈 Descriptive statistics focuses on summarizing and presenting data meaningfully, while inferential statistics makes inferences and predictions about a population based on sample data.
  • 🔢 Descriptive statistics includes measures of central tendency (mean, median, mode), spread (range, variance, standard deviation), and shape (symmetry and modality).
  • 📈 The mean is calculated by dividing the sum of all data points by the number of observations.
  • 🔄 The median is the middle value in an ordered data set; for an even number of data points, it's the average of the two middle values.
  • 🔝 The mode is the most frequently occurring value in a data set.
  • 📊 Measures of spread include range (max - min), variance (average of the squared differences from the mean), and standard deviation (square root of variance).
  • 🌐 Symmetry in data can be symmetric, showing equal distribution around the mean (like a normal distribution), or asymmetric, indicating a skew.
  • 📊 Modality refers to the number of peaks in a distribution, indicating unimodal (one peak), bimodal (two peaks), or multimodal (more than two peaks).
  • 🔮 Inferential statistics encompasses confidence intervals, hypothesis testing, and regression analysis for making predictions about a population from sample data.

Q & A

  • What is the definition of statistics as mentioned in the video?

    -Statistics is a branch of mathematics that deals with the collection, analysis, interpretation, presentation, and organization of data. It is used in a wide variety of fields, including business, finance, and science.

  • Who is considered the father of statistics and what was his nationality?

    -Gottfried Wilhelm Leibniz, a German philosopher and economist, is often referred to as the father of statistics.

  • How does statistics combine different areas of mathematics to analyze data?

    -Statistics combines elements of trigonometry, geometry, algebra, calculus, the number system, and other areas of mathematics to add power to data analysis and draw meaningful conclusions.

  • What are the two main branches of statistics discussed in the video?

    -The two main branches of statistics discussed are descriptive statistics and inferential statistics.

  • What is the purpose of descriptive statistics?

    -Descriptive statistics is about summarizing and presenting data in a meaningful way.

  • What are the three measures of central tendency mentioned in the video?

    -The three measures of central tendency are mean, median, and mode.

  • How is the mean calculated for a given set of data?

    -The mean is calculated by summing all the data points and then dividing by the number of observations.

  • What is the difference between calculating the median for an odd and an even number of data points?

    -For an odd number of data points, the median is the middle value when arranged in ascending order. For an even number of data points, the median is the average of the two middle values.

  • What is the mode in statistics and how is it determined?

    -The mode is the most frequently occurring value in a data set.

  • What are the three components of the measure of spread or variability in descriptive statistics?

    -The three components of the measure of spread or variability are range, variance, and standard deviation.

  • How is the range calculated for a given set of data?

    -The range is calculated by subtracting the minimum value from the maximum value in the data set.

  • What is the formula for calculating variance for a sample of data?

    -The formula for calculating variance for a sample is the sum of the squared differences between each data point and the mean, divided by the number of data points minus one.

  • What is the relationship between variance and standard deviation?

    -The standard deviation is the square root of the variance.

  • What are the two components of the measure of shape in descriptive statistics?

    -The two components of the measure of shape are symmetry and modality.

  • What is the difference between a positive skew and a negative skew in data distribution?

    -In a positive skew, the tail on the right side of the distribution is longer, and the mean and median are greater than the mode. In a negative skew, the tail on the left side is longer, and the mean and median are less than the mode.

  • What are the three main components of inferential statistics?

    -The three main components of inferential statistics are confidence intervals, hypothesis testing, and regression analysis.

  • What is the primary goal of inferential statistics?

    -The primary goal of inferential statistics is to make inferences and predictions about a population based on a sample of data.

  • What does the video suggest doing if you want to learn more about confidence intervals, regression analysis, and hypothesis testing?

    -The video suggests checking out additional videos on these topics available on the presenter's YouTube channel, with the link provided in the description.

Outlines

00:00

📊 Introduction to Statistics and Descriptive vs Inferential Statistics

This paragraph introduces the concept of statistics as a branch of mathematics that involves the collection, analysis, interpretation, and presentation of data. It highlights the wide application of statistics in various fields such as business and finance. The paragraph also mentions the origin of statistics, credited to the German philosopher and economist, Gottfried Wilhelm Leibniz, known as the 'father of statistics.' The distinction between descriptive and inferential statistics is briefly explained, with descriptive focusing on summarizing and presenting data, while inferential is concerned with making inferences and predictions about a population based on sample data.

05:01

📈 Descriptive Statistics: Measures of Central Tendency, Spread, and Shape

Descriptive statistics is elaborated upon with a focus on summarizing and presenting data meaningfully. It is broken down into measures of central tendency, including mean, median, and mode, with an example provided to calculate each. The mean is calculated by dividing the sum of data by the number of observations, the median is the middle value when data is ordered, and the mode is the most frequently occurring value. Measures of spread, such as range, variance, and standard deviation, are explained to analyze the dispersion of data. The range is the difference between the maximum and minimum values, variance is the average of the squared differences from the mean, and standard deviation is the square root of variance. Lastly, the measure of shape discusses symmetry and modality, explaining symmetric and asymmetric distributions, as well as unimodal, bimodal, and multimodal distributions.

🔍 Inferential Statistics: Confidence Intervals, Hypothesis Testing, and Regression Analysis

The focus shifts to inferential statistics, which involves making inferences and predictions about a population based on sample data. The paragraph outlines three main components of inferential statistics: confidence intervals, hypothesis testing, and regression analysis. It encourages viewers to check out additional videos on these topics available on the presenter's YouTube channel, with a link provided in the description. The paragraph concludes with a call to action for viewers to subscribe, hit the bell for notifications, like, share, and comment on the video. It also invites viewers to participate in a quiz related to the topic by answering questions in the comment section.

Mindmap

Keywords

💡Statistics

Statistics is a branch of mathematics that deals with the collection, analysis, interpretation, presentation, and organization of data. It is integral to a wide variety of fields, including business and finance. In the video, statistics are divided into two main types: descriptive and inferential, and their applications are discussed to emphasize the importance of data analysis in drawing meaningful conclusions.

💡Descriptive Statistics

Descriptive statistics is concerned with summarizing and presenting data in a meaningful way. It includes measures of central tendency, variability, and shape, which help to describe the main features of a dataset. In the script, descriptive statistics are broken down into measures like mean, median, mode, range, variance, and standard deviation, providing examples to illustrate their calculation and significance.

💡Inferential Statistics

Inferential statistics is the process of making inferences and predictions about a population based on a sample of data. It involves techniques such as confidence intervals, hypothesis testing, and regression analysis. The video mentions that inferential statistics allows for broader conclusions beyond the immediate data, which is crucial for decision-making and understanding underlying patterns.

💡Measure of Central Tendency

Measure of central tendency refers to the central or typical value in a dataset, which is used to describe the center point of the data distribution. The script introduces three measures of central tendency: mean, median, and mode. These measures are essential for understanding the average or typical values within a dataset, as illustrated with the example data set provided.

💡Mean

The mean, often referred to as the average, is calculated by summing all the values in a data set and dividing by the number of observations. In the video, the mean is calculated for a given data set to demonstrate how it represents the central value of the data, which is crucial for descriptive statistics.

💡Median

The median is the middle value of a data set when the numbers are arranged in ascending order. If there is an even number of observations, the median is the average of the two middle numbers. The script explains how to calculate the median and its importance in providing a central value that is less affected by outliers compared to the mean.

💡Mode

The mode is the value that appears most frequently in a data set. It is a measure of central tendency that can be used to identify the most common occurrence. The video script provides an example where the mode is determined by identifying the most frequently occurring value in a given data set.

💡Measure of Variability

Measure of variability, also known as measure of spread, helps in understanding how data points are dispersed within a set. It includes range, variance, and standard deviation. The script explains these measures, emphasizing their importance in data analysis for understanding the distribution and dispersion of data points.

💡Range

The range is the difference between the maximum and minimum values in a data set. It provides a simple measure of variability by showing the spread of the data. In the video, the range is calculated for an example data set to illustrate its role in understanding the dispersion of data.

💡Variance

Variance is a measure of how much the values in a data set vary from the mean. It is calculated as the average of the squared differences from the mean. The script explains the formula for calculating variance and provides an example to demonstrate its significance in measuring the spread of data.

💡Standard Deviation

Standard deviation is the square root of the variance and represents the average distance of each data point from the mean. It is a key measure in understanding the dispersion of data points around the central value. The video script includes the calculation of standard deviation to show its role in descriptive statistics.

💡Measure of Shape

Measure of shape refers to the characteristics of the distribution of data, including symmetry and modality. Symmetry can be symmetric or asymmetric, and modality can be unimodal, bimodal, or multimodal. The script explains these concepts and their importance in understanding the overall shape and distribution of a dataset.

💡Symmetric Distribution

A symmetric distribution is one where the data is evenly distributed around the mean, with equal areas on both sides of the distribution curve. The normal distribution curve is an example of a symmetric distribution. The video script uses the concept of symmetry to explain how data can be evenly distributed, which is important for understanding the shape of the data.

💡Skewness

Skewness refers to the lack of symmetry in the data distribution. Positive skewness indicates that the right tail of the distribution is longer or flatter, while negative skewness indicates the opposite. The script explains skewness in the context of data distribution and how it affects the relationship between mean, median, and mode.

💡Modality

Modality refers to the number of peaks in a data distribution. A dataset can be unimodal (one peak), bimodal (two peaks), or multimodal (more than two peaks). The script discusses modality as part of the measure of shape, highlighting its importance in understanding the distribution's characteristics.

💡Confidence Interval

A confidence interval is a range within which we expect the population parameter to lie, with a certain level of confidence. It is a key concept in inferential statistics, allowing researchers to make estimates about the population based on sample data. The video mentions confidence intervals as part of inferential statistics, indicating their use in making inferences about populations.

💡Hypothesis Testing

Hypothesis testing is a statistical method used to make decisions about a population parameter based on sample data. It involves formulating a null hypothesis and an alternative hypothesis and then using statistical tests to determine if there is enough evidence to reject the null hypothesis. The script refers to hypothesis testing as a component of inferential statistics, emphasizing its role in making inferences about populations.

💡Regression Analysis

Regression analysis is a statistical method used to examine the relationship between two or more variables. It helps in understanding how the value of one variable changes in response to changes in another variable. The video script mentions regression analysis as part of inferential statistics, indicating its importance in predicting and understanding relationships between variables.

Highlights

Statistics is a branch of mathematics that deals with the collection, analysis, interpretation, presentation, and organization of data.

Statistics is used in a wide variety of fields including business, finance, and science.

Gottfried Wilhelm Leibniz is known as the father of Statistics.

Statistics combines elements of trigonometry, geometry, algebra, calculus, and number systems to analyze data.

Descriptive statistics summarizes and presents data in a meaningful way.

Inferential statistics makes inferences and predictions about a population based on a sample of data.

Measures of central tendency include mean, median, and mode.

The mean is calculated by dividing the sum of all data points by the number of observations.

The median is the middle value in an ordered data set, or the average of the two middle values if the set is even.

The mode is the most frequently occurring value in a data set.

Measures of spread or variability include range, variance, and standard deviation.

The range is the difference between the maximum and minimum values in a data set.

Variance is calculated as the average of the squared differences from the mean.

Standard deviation is the square root of variance and measures the spread of data points around the mean.

Measures of shape include symmetry and modality, which describe the distribution of data.

Symmetry can be symmetric, positively skewed, or negatively skewed.

Modality refers to the number of peaks in a distribution, such as unimodal, bimodal, or multimodal.

Inferential statistics includes confidence intervals, hypothesis testing, and regression analysis.

Confidence intervals, hypothesis testing, and regression analysis are used to make inferences about a population from sample data.

The video provides a quiz at the end for viewers to test their understanding of the topic.

The video encourages viewers to subscribe, hit the like button, and share the video with friends and colleagues.

Transcripts

play00:00

Hello friends welcome back so in this

play00:02

short video we'll discuss different

play00:03

types of Statistics descriptive versus

play00:06

influential statistics with help of some

play00:08

relevant examples so please stay tuned

play00:11

don't go anywhere else just sit back

play00:13

relax and enjoy this

play00:15

video so before we Deep dive into what

play00:18

are different types of Statistics let us

play00:21

understand the statistics first so

play00:23

statistics is a branch of mathematics

play00:26

that deals with collection analysis

play00:28

interpretation presentation and

play00:30

organization of data it is used in wide

play00:34

variety of fields including business

play00:36

finance science and whatnot it was first

play00:40

discovered by godfried who is a German

play00:43

philosopher and Economist who invented

play00:45

the statistics is also known as the

play00:48

father of

play00:49

Statistics so statistics which is

play00:51

basically a branch of mathematics join

play00:54

forces of trignometry geometry algebra

play00:57

calculus number system and athematics

play00:59

adding the power to analyze the data and

play01:03

draw a meaningful conclusion make it

play01:05

essential tune in various

play01:08

Fields statistics further bifurcate into

play01:11

descriptive and influential

play01:14

statistics so let let me briefly touch

play01:16

about what is descriptive here so

play01:18

descriptive statistics talks about

play01:20

summarizing and presenting data in a

play01:22

meaningful way that is your descriptive

play01:24

statistics while inferential statistics

play01:27

is more concerned with making the

play01:30

inferences and predictions about a

play01:32

population based on the sample of data I

play01:36

will touch base more about in the coming

play01:37

slide but this is the basic between the

play01:39

descriptive and the inferential

play01:42

statistics so let's start with

play01:44

descriptive statistics first so

play01:46

descriptive statistics is all about

play01:48

summarizing and presenting data in a

play01:50

meaningful way it is further broken down

play01:52

into measure of central tendency measure

play01:55

of spread where there is variability and

play01:57

measure of shape let start start with

play02:00

first the measure of central tendency

play02:02

which is for the bated into mean median

play02:04

and mode

play02:06

here let's assume that we have following

play02:08

state of data 10 20 30 20 40 20 10 we

play02:13

need to First calculate the mean so

play02:15

assuming that we sum this all the data

play02:18

that we have it comes to 150 number of

play02:21

observation is 7 uh mean would be 15

play02:24

divid by 7 so mean comes up to be

play02:28

21.42%

play02:30

now let's calculate the median for same

play02:32

set of data formula is n + 1 / 2 so if

play02:37

the number of values is odd the median

play02:39

is the middle value and arrange in the

play02:41

ascending order that means we need to

play02:43

arrange the data in ascending order find

play02:45

the middle value that will be your

play02:47

median if the number of data set is odd

play02:50

but if the number of data set is even

play02:53

the median would be the average of the

play02:54

two middle values when arranged in the

play02:56

ascending order so in same case arrange

play02:58

the data first ascending order if the

play03:00

number of data set is even find out the

play03:03

two middle values take average of that

play03:05

that will be your median in our case the

play03:08

number of data set was seven when we

play03:11

arrange in the sending order these are

play03:13

the values so Med median of these data

play03:16

set is 20 since the number of values is

play03:19

odd

play03:20

here the third under measure of central

play03:23

tendency is the mode and mode is the

play03:25

most frequently occurring value so in

play03:27

this case you have to see the most

play03:29

frequently oing value is 20 here so our

play03:32

mode would be 20 this is as simple as

play03:36

that the next mejor under descriptive is

play03:38

measure of spread of variability which

play03:40

AIDS in analyzing how disperse the

play03:43

distribution is for given set of data

play03:45

for example the measure of central

play03:47

tendency that we have just seen may give

play03:49

a person the average of data in the form

play03:51

of mean median or mode but it does not

play03:54

describe how the data set is distributed

play03:57

within the set for that we have measure

play03:59

of of SPO

play04:00

variability it has three components

play04:03

range variance and standard deviation

play04:06

let's assume that you have following set

play04:08

of data we need to First calculate the

play04:10

range so range is nothing but maximum

play04:13

value minus the minimum value in this

play04:16

case it is like 72 - 49 which comes to

play04:19

23 now let's calculate the variance

play04:22

which is given by this formula that

play04:24

summation x i - xar s/ n - 1 where x i

play04:29

is the individual value xar is the

play04:31

average of all the values and N is the

play04:33

number of data points and this formula

play04:36

is for sample data not for population

play04:38

for population replace n minus one by n

play04:42

Only so in this case average comes out

play04:44

to be

play04:46

61.3 so we put this value in the formula

play04:49

49 - 61.3 whole Square so on WE and

play04:53

divide by 10 - 1 we get variance as 62.2

play04:57

3 now we need to calculate the standard

play04:59

deviation which is nothing but the

play05:01

square root of variance which comes up

play05:03

to be 7.88 n so that is how you

play05:06

calculate range variance and standard

play05:10

deviation the third measure under

play05:12

descriptive statistics is a measure of

play05:14

shape that is which has two components

play05:16

Symmetry and modality for symmetry it is

play05:20

either symmetric which is the best

play05:22

example could be the normal distribution

play05:24

curve which has equal area on both sides

play05:26

and is symmetric about the main and

play05:30

about asymmetric which is opposite of

play05:32

that when which it is not symmetric

play05:34

about the mean it is either positive

play05:36

skew or negative skewed so positive

play05:39

skewed is when the tail is on the right

play05:41

side of distribution is longer and

play05:44

flatter tail is on the left side that

play05:47

means the mean and median will be

play05:49

greater than the mode here in the

play05:50

positive skewed for negative skew is

play05:53

when the tail on the left side of

play05:56

distribution is longer or flatter than

play05:59

the tail on the right side that means

play06:01

the mean and the median will be less

play06:03

here than the mode that is the uh

play06:06

symmetry

play06:08

here next is the modality so modality of

play06:11

a distribution is determined by the

play06:13

number of peak it contains so if it is

play06:16

uni model it has one value that occurs

play06:18

most frequently that is one Peak if it

play06:21

is B model it has two values that occurs

play06:24

frequently two peaks and if it is

play06:26

multimodal it has to several frequently

play06:29

occurring values that means more than

play06:31

two peaks unimodel Bodel and

play06:36

multimodel so now let's shift our Focus

play06:38

to inferential statistics which has

play06:40

three component confidence interval

play06:42

hypothesis testing and regression

play06:44

analysis so this branch is more

play06:46

concerned about making inferences and

play06:48

production about the population based on

play06:50

the sample of data so all these videos

play06:53

on confidence interval regression

play06:55

analysis and hypothesis testing are

play06:58

available on my YouTube channel the link

play07:00

for these videos is given in the

play07:01

description below do check out that as

play07:04

well so if you are still watching this

play07:06

video don't forget to hit the Subscribe

play07:08

button and do press the Bell icon for

play07:11

all the notification from digital

play07:13

e-learning and if you like this video

play07:15

don't forget to hit the like button as

play07:17

well share this video with all your

play07:19

friends and colleague and in case if you

play07:21

have any sessions or comment do let me

play07:23

know in the comment box below now is the

play07:26

quiz time on this

play07:28

topic

play07:30

read the questions and leave your

play07:31

answers in the comment section below

play07:34

first question which of the following is

play07:36

a major of central tendency and

play07:38

descriptive statistics standard

play07:41

deviation range mean or variance if a

play07:44

data set has outliers which measure of

play07:47

central tendency is more appropriate to

play07:49

use mean median mode or

play07:52

range which of the following measures

play07:55

provide the information about the spread

play07:57

of variability of data set mean median

play08:00

range or mode you can leave your answers

play08:04

in the comment section

play08:08

[Music]

play08:13

[Applause]

play08:16

[Music]

play08:26

below

Rate This

5.0 / 5 (0 votes)

الوسوم ذات الصلة
Descriptive StatisticsInferential StatisticsData AnalysisMeasures of Central TendencyMeasures of VariabilityData InterpretationStatistical InferenceSample DataPopulation DataStatistical ConceptsEducational Content
هل تحتاج إلى تلخيص باللغة الإنجليزية؟