Statistika (Distribusi Frekuensi Data Tunggal dan Kelompok)
Summary
TLDRIn this video, the instructor teaches statistical concepts, focusing on frequency distribution tables. The lesson covers two main types: the single frequency distribution table, used for smaller data sets, and the grouped frequency distribution table, designed for larger data sets. Through examples of math test scores and final exam grades, the instructor demonstrates how to organize data, calculate frequencies, and determine the number of classes and class widths. The video offers step-by-step guidance to help students understand these key statistical methods, ultimately enhancing their skills in handling data sets efficiently.
Takeaways
- 😀 Introduction to the topic of statistics and frequency distribution tables.
- 😀 The lesson covers two main types of frequency distribution tables: singular and grouped.
- 😀 Singular frequency distribution is used when the dataset is small and consists of distinct values.
- 😀 Grouped frequency distribution is for larger datasets and involves grouping values into intervals.
- 😀 The teacher demonstrates creating a singular frequency distribution table using math test scores.
- 😀 In the singular table, you identify values, tally frequencies, and sum them up for accuracy.
- 😀 For grouped frequency distribution, you first determine the maximum and minimum values of the dataset.
- 😀 You calculate the number of classes (intervals) using the formula: 1 + 3.3 * log(n), where n is the number of data points.
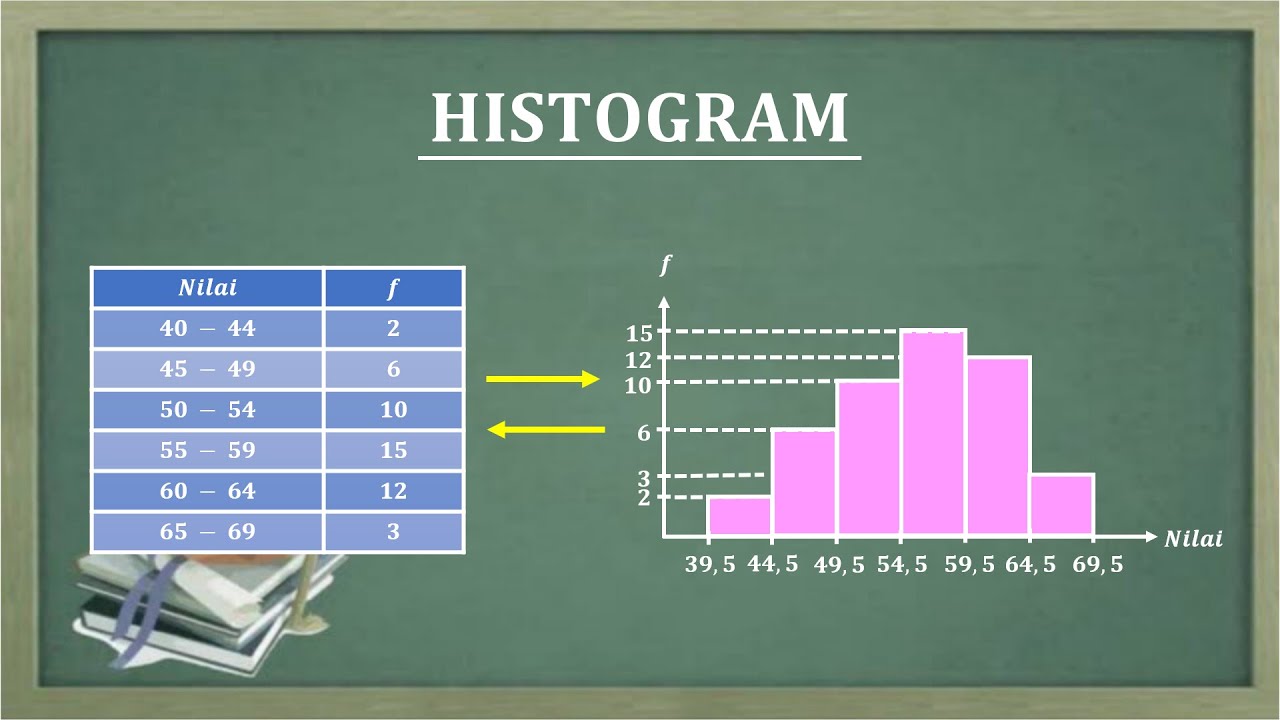
- 😀 The class intervals are created by calculating the class width and defining the ranges (e.g., 41-48, 49-56).
- 😀 Once the intervals are set, you fill in the frequency for each class and ensure the total matches the data count.
Q & A
What is the difference between a single frequency distribution and a grouped frequency distribution?
-A single frequency distribution is used when the dataset is small, where each data point is listed individually. A grouped frequency distribution is used when the dataset is large, and the data is grouped into intervals or ranges.
When should a single frequency distribution be used?
-A single frequency distribution should be used when the dataset is small, and the data points can be listed individually without the need for grouping.
What are the first steps in creating a single frequency distribution table?
-The first steps include identifying the values in the dataset and organizing them in ascending order. Then, calculate the frequency of each value.
How is the frequency for a value in a single frequency distribution table calculated?
-The frequency for each value is calculated by counting how many times each value appears in the dataset.
What are the key steps in creating a grouped frequency distribution table?
-Key steps include determining the minimum and maximum values, calculating the range (difference between maximum and minimum), determining the number of classes, calculating the class width, and then grouping the data into intervals. Afterward, tally the frequencies for each interval.
How do you determine the number of classes for a grouped frequency distribution?
-The number of classes is determined using the formula: `1 + 3.3 * log(n)`, where n is the number of data points in the dataset.
What is the formula used to calculate the number of classes in a grouped frequency distribution?
-The formula is `1 + 3.3 * log(n)`, where n is the number of data points.
How do you calculate the class width in a grouped frequency distribution?
-The class width is calculated by dividing the range (the difference between the maximum and minimum values) by the number of classes.
How do you create intervals for a grouped frequency distribution?
-Intervals are created by starting from the minimum value and adding the class width to form the upper bound for each class. The process continues until all data points are covered.
What should you do after creating the intervals for a grouped frequency distribution?
-After creating the intervals, you should tally the frequencies for each interval and sum them to verify the correctness of the data. The total frequency should match the number of data points.
Outlines

هذا القسم متوفر فقط للمشتركين. يرجى الترقية للوصول إلى هذه الميزة.
قم بالترقية الآنMindmap

هذا القسم متوفر فقط للمشتركين. يرجى الترقية للوصول إلى هذه الميزة.
قم بالترقية الآنKeywords

هذا القسم متوفر فقط للمشتركين. يرجى الترقية للوصول إلى هذه الميزة.
قم بالترقية الآنHighlights

هذا القسم متوفر فقط للمشتركين. يرجى الترقية للوصول إلى هذه الميزة.
قم بالترقية الآنTranscripts

هذا القسم متوفر فقط للمشتركين. يرجى الترقية للوصول إلى هذه الميزة.
قم بالترقية الآنتصفح المزيد من مقاطع الفيديو ذات الصلة
Statistika - Membaca dan Menyajikan data, Poligon Histogram Ogive

VIDEO PEMBELAJARAN DARING STATISTIKA MODEL PROBLEM BASED LEARNING PPG DALJAB UNNES 2020

FREQUENCY DISTRIBUTION: Common Terminologies Vid#4 FREE Tutorial | Statistics | EASILY EXPLAINED!
HISTOGRAM

What is a Frequency Distribution in Statistics?
Statistika 05 | Distribusi Frekuensi dalam Statistika | Frequency Distribution | Belajar Statistika
5.0 / 5 (0 votes)
