Calculating Seasonal Indexes (without trend) in Excel | Forecasting
Summary
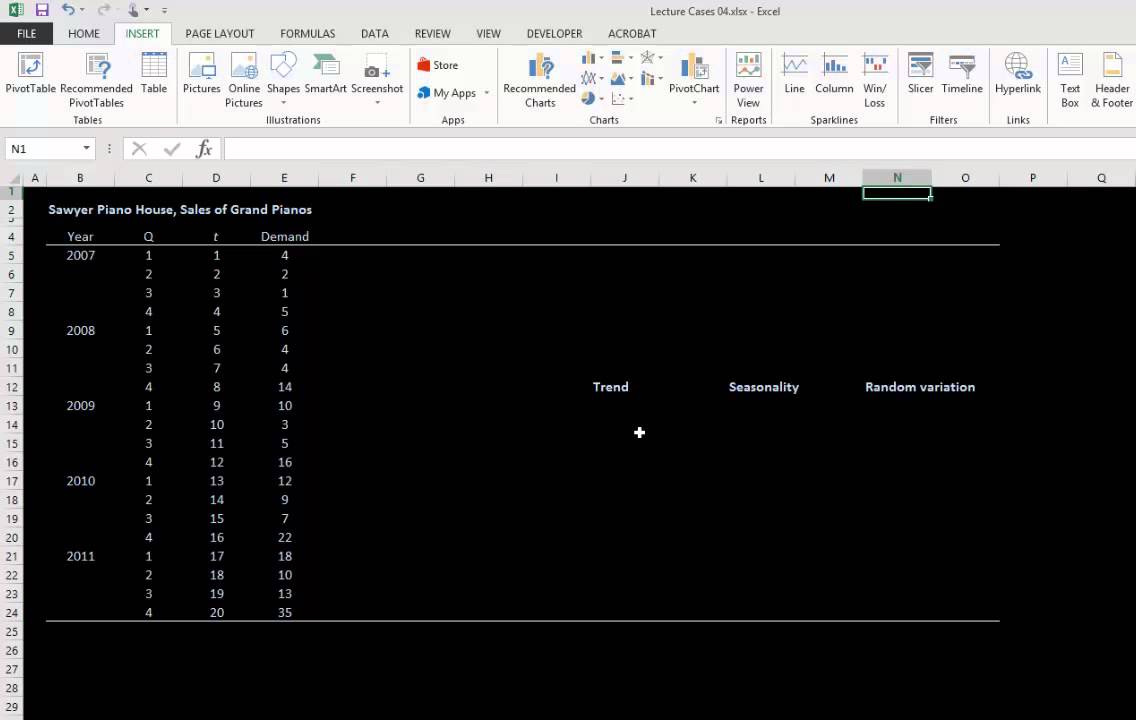
TLDRIn this video, the presenter demonstrates how to compute seasonal indexes for demand data and use them to forecast future demand. The process involves calculating quarterly averages, finding an overall average, and then deriving seasonal indexes by dividing each quarterly average by the overall average. These indexes are interpreted to reflect whether demand is above or below average for each quarter. Finally, the seasonal indexes are applied to forecast quarterly demand for year 5, assuming a total projected demand of 360,000. This method provides an insightful approach to forecasting with seasonality adjustments.
Takeaways
- 😀 The first step is to calculate the average quarterly demand for each quarter in the dataset.
- 😀 After calculating the quarterly averages, the overall average for the entire data set is determined.
- 😀 To find the seasonal index, each quarterly average is divided by the overall average to reflect seasonal variation.
- 😀 The seasonal indexes should add up to four, representing the four quarters of the year.
- 😀 If the seasonal indexes do not add up to four, they may need to be normalized for accurate forecasting.
- 😀 To interpret the seasonal indexes, subtract 1 from each value to understand how demand compares to the overall average.
- 😀 A negative seasonal index (e.g., -0.23) indicates that demand is below average for that quarter, while a positive index indicates demand above average.
- 😀 For Year 5, if the projected total demand is 360,000, the average demand per quarter is calculated by dividing this total by four (90,000 per quarter).
- 😀 Seasonal indexes are applied to the average forecast values to adjust for seasonal variation, yielding the seasonal forecast for each quarter.
- 😀 The final step involves multiplying the average forecast for each quarter by the corresponding seasonal index to obtain the seasonal forecast for Year 5.
Q & A
What is the first step in computing seasonal indexes for demand data?
-The first step is to compute the average demand for each of the quarters.
How do you calculate the overall average demand from the data?
-The overall average can be calculated by either averaging all the data points or averaging the quarterly averages, which in this case gives 87.625.
What is the formula used to calculate the seasonal index for each quarter?
-The seasonal index for each quarter is calculated by dividing the quarterly average demand by the overall average demand.
Why is it important to lock the overall average using F4 when applying the formula?
-Locking the overall average with F4 ensures that the value remains constant as you drag the formula across all quarters.
What should the sum of the seasonal indexes be, and why?
-The sum of the seasonal indexes should be 4, as there are 4 quarters in a year. If the sum is not 4, the indexes need to be normalized.
How can the seasonal index values be interpreted?
-By subtracting 1 from each seasonal index, we can interpret the results as the percentage deviation from the average demand. A negative value indicates demand below average, while a positive value indicates demand above average.
What does a seasonal index of -0.23 mean in terms of demand for a particular quarter?
-A seasonal index of -0.23 means that in Quarter 1, the demand is 23% below the average demand.
How is the projected quarterly demand for Year 5 calculated?
-To calculate the projected quarterly demand for Year 5, first, divide the total projected demand (360,000) by 4 to get the average quarterly demand assuming no seasonality (90,000). Then, multiply each quarterly average by the corresponding seasonal index to adjust for seasonality.
What is the projected total demand for Year 5, and how is it used in the calculation?
-The projected total demand for Year 5 is 360,000 units. This value is used to estimate the average quarterly demand (90,000 units) and to apply the seasonal indexes for forecasting quarterly demand.
What does multiplying the average quarterly demand by the seasonal index achieve in the forecasting process?
-Multiplying the average quarterly demand by the seasonal index adjusts the forecast to account for seasonal variations in demand. This gives the seasonal forecast for each quarter.
Outlines

هذا القسم متوفر فقط للمشتركين. يرجى الترقية للوصول إلى هذه الميزة.
قم بالترقية الآنMindmap

هذا القسم متوفر فقط للمشتركين. يرجى الترقية للوصول إلى هذه الميزة.
قم بالترقية الآنKeywords

هذا القسم متوفر فقط للمشتركين. يرجى الترقية للوصول إلى هذه الميزة.
قم بالترقية الآنHighlights

هذا القسم متوفر فقط للمشتركين. يرجى الترقية للوصول إلى هذه الميزة.
قم بالترقية الآنTranscripts

هذا القسم متوفر فقط للمشتركين. يرجى الترقية للوصول إلى هذه الميزة.
قم بالترقية الآنتصفح المزيد من مقاطع الفيديو ذات الصلة
5.0 / 5 (0 votes)


