PRONOSTICOS DE VENTAS (Modelo Regresión Lineal)
Summary
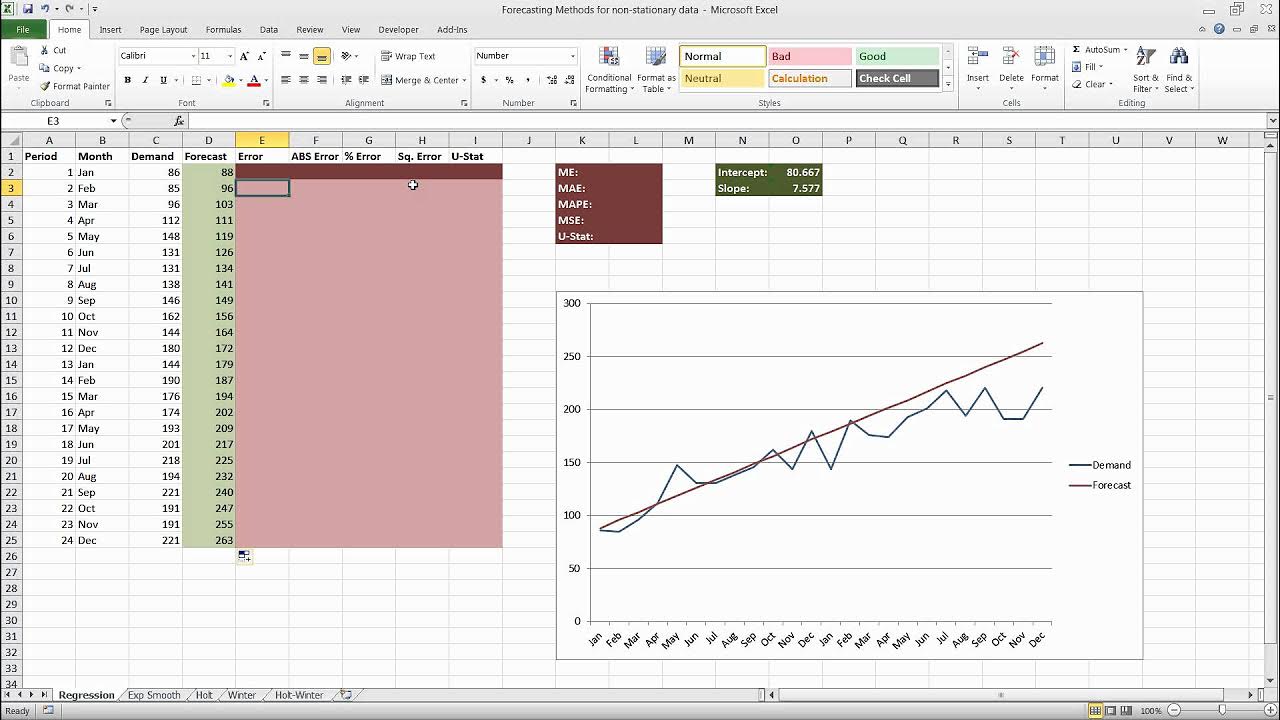
TLDRThe video explains the process of using linear regression for forecasting demand based on time periods. The speaker covers the concepts of dependent and independent variables, where sales (demand) are the dependent variable, and time is the independent variable. Through a series of formulas, the speaker demonstrates how to calculate the regression coefficients (a and b) and apply them to predict future demand. An example using six periods and demand data is worked through to calculate a forecast for the 7th period. The method is compared to other forecasting techniques, showing its practical application and effectiveness.
Takeaways
- 😀 The script explains the use of linear regression for forecasting sales or demand based on periods and actual data.
- 😀 The method involves using a linear equation, where the dependent variable (Y) represents sales and the independent variable (X) represents time (periods).
- 😀 The goal is to calculate the forecast for future periods using the linear regression model.
- 😀 In the formula, 'a' represents the y-intercept, and 'b' represents the slope of the line in the regression equation.
- 😀 To calculate the forecast, specific formulas are used to compute values for 'a' and 'b', which are then used to predict future values.
- 😀 The calculation of 'b' involves summations of the variables X and Y, their products, and their squares, following a detailed formula.
- 😀 The calculation of 'a' similarly involves summations and products of X and Y, adjusted for the number of periods (n).
- 😀 The script includes a worked-out example using six periods of data, with sales values provided to calculate the forecast for the seventh period.
- 😀 The process involves detailed steps like calculating the sum of X, Y, X squared, and the product of X and Y to use in the formula.
- 😀 By substituting values into the linear regression equation, the forecast for the seventh period is found to be 22 sales units.
- 😀 The script highlights that linear regression is a reliable method for forecasting, but it can be compared with other methods like exponential smoothing or moving averages for accuracy.
Q & A
What is the purpose of using linear regression in this context?
-Linear regression is used to forecast future demand based on historical data, using the relationship between periods (time) and actual demand (sales).
What is the dependent variable in the linear regression model presented?
-The dependent variable is the demand or sales (y), as it is the outcome that is being predicted.
What does the independent variable represent in the linear regression model?
-The independent variable is time or the period (x), as it is used to predict the demand or sales (y).
What are the two main parameters of the linear regression equation?
-The two main parameters are the intercept (a) and the slope (b). The intercept represents the starting value, while the slope shows the rate of change with respect to time (x).
How is the slope (b) in the linear regression formula calculated?
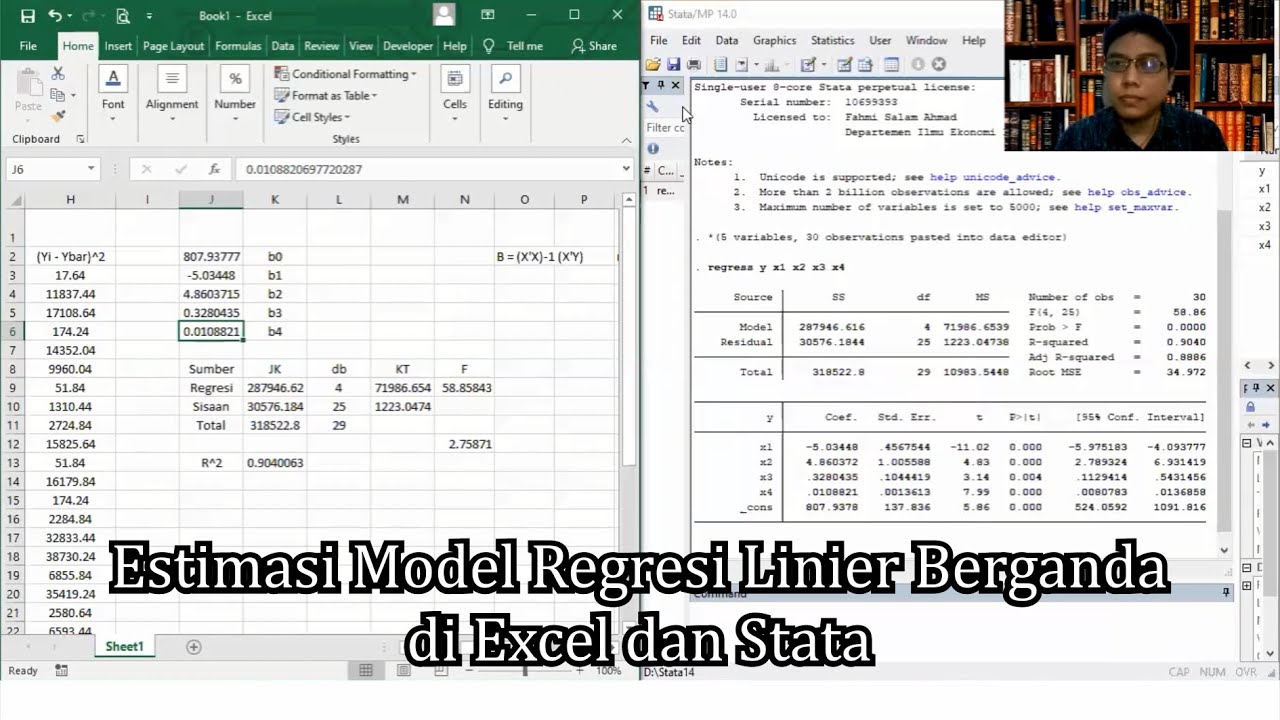
-The slope (b) is calculated using the formula: b = (n * Σxy - Σx * Σy) / (n * Σx² - (Σx)²), where n is the number of periods, and Σx, Σy, Σxy, and Σx² are summations based on the data.
What is the formula used to calculate the intercept (a) in the linear regression model?
-The intercept (a) is calculated using the formula: a = (Σx² * Σy - Σx * Σxy) / (n * Σx² - (Σx)²). This formula involves summing the values of x, y, and their products.
How do you forecast the demand for a future period using the linear regression model?
-To forecast the demand for a future period, substitute the period value (x) into the regression equation y = a + b * x, where a and b are the calculated intercept and slope values.
What are the key data points required to apply the linear regression method for forecasting?
-The key data points are the periods (x values) and the corresponding demand values (y values). From this data, summations such as Σx, Σy, Σx², and Σxy are calculated.
What is the significance of the variable 'n' in the formulas for b and a?
-'n' represents the number of periods (data points) in the dataset, and it is used in the calculations for both the slope (b) and the intercept (a).
How is the forecasted demand for period 7 calculated in the example?
-To forecast the demand for period 7, the calculated intercept (a) and slope (b) are substituted into the equation, using x = 7. This results in a forecasted value of 22 for period 7.
Outlines

This section is available to paid users only. Please upgrade to access this part.
Upgrade NowMindmap

This section is available to paid users only. Please upgrade to access this part.
Upgrade NowKeywords

This section is available to paid users only. Please upgrade to access this part.
Upgrade NowHighlights

This section is available to paid users only. Please upgrade to access this part.
Upgrade NowTranscripts

This section is available to paid users only. Please upgrade to access this part.
Upgrade NowBrowse More Related Video

How to make Forecasting! | Quantitative Forecasting with Least Squares Method | Quickly & easily
Forecasting in Excel Using Simple Linear Regression

Introduction to Time Series Forecasting | SCMT 3623
Praktikum Ekonometrika I P4 - Regresi Linier Berganda

MANAJEMEN OPERASI - Memahami Peramalan (Forecasting)
Time Series Talk : Autoregressive Model
5.0 / 5 (0 votes)